Crypto Charts: Understanding and Reading Crypto Chart Patterns
Cryptocurrencies move fast, and keeping up requires skill. For beginners and experienced traders alike, crypto charts unlock crucial insights. These visual tools reveal market trends, underlying sentiment, and the best moments to buy or sell.
Key Notes:
Crypto chart types—line, bar, and especially candlestick charts—offer different levels of price detail and are essential for technical analysis and informed decision-making.
Recognizing single-candle and multi-candle chart patterns, such as doji, head and shoulders, triangles, and flags, helps traders predict potential market direction, reversals, and continuations.
The reliability and effectiveness of chart patterns increase when paired with technical indicators like RSI, MACD, moving averages, and volume, supporting more robust and accurate trading signals.
Applying risk management, confirmation strategies, and using advanced charting tools empowers traders to maximize pattern analysis and adapt successfully to changing crypto markets.
What are crypto charts and why do they matter for traders?
A crypto chart is a visual display of price changes over time for a digital asset. By tracking price action, volume, and patterns, traders gain clarity and confidence in their decisions. Charts for cryptocurrency are essential for making sense of market movements.
Whether you’re investing for weeks, months, or making quick trades, crypto charts offer valuable trading signals. Analysing charts of cryptocurrency price action helps you anticipate trends and react to market changes efficiently. The skill to interpret a crypto chart is essential for success.
Short-term traders use crypto charts for rapid entries and exits. Medium-term investors monitor bigger trends shaping asset value. Long-term holders value charts for cryptocurrency to spot reversals or strong upward momentum.
Types of crypto charts
Not every chart of cryptocurrency data is identical. The three main types include line charts, bar charts, and candlestick charts.
Line charts provide a simple view, connecting closing prices: great for long-term overview but lacking detail. Bar charts show more, adding high, low, open, and close for each period.
The star is the candlestick chart—especially the bitcoin candlestick chart. Crypto candlestick charts pack volumes of information into each ‘candle’. That’s why both beginners and pros rely on candlestick charts for spotting crypto patterns and key trading signals.
Basics of Reading Crypto Candlestick Charts
Understanding the anatomy of a crypto candlestick chart is step one to mastering the art of technical analysis.
Every candle features a body and ‘wicks’ (also called shadows). The candle body shows whether the price closed higher (green/bullish) or lower (red/bearish) than it opened. The top and bottom of the candle represent the opening and closing prices for that time period.
The thin wicks show the highest and lowest prices reached. This visual summary helps traders identify whether the market is trending, pausing, or reversing.
By grouping these candles together, traders can spot crypto patterns that hint at where the next breakout, reversal, or continuation may lie. The bitcoin candlestick chart is key for understanding shifts in momentum, finding support and resistance, and reacting to trading signals.
Want real market insights? Review a crypto chart with multiple candlesticks—patterns often emerge that single data points cannot reveal.
You may also like to read: How to Invest in Cryptocurrency (Your Guide to Long-Term Crypto Investment)
What Are Crypto Chart Patterns?
Crypto chart patterns are shapes formed by collections of candlesticks that repeat across various timeframes. These crypto patterns are foundational to technical analysis, providing a map for predicting market action before it happens.
Why care about crypto chart patterns? Because cryptocurrency prices are volatile, patterns can signal trend reversals, upcoming breakouts, or continuation of moves. Spotting chart patterns crypto traders trust boosts your timing and confidence.
Reversal patterns hint that prices will change direction. Continuation patterns signal that the current trend could resume after a brief pause. Understanding both is essential for any crypto trader looking to master the art of using a bitcoin candlestick chart.
How chart patterns are used in technical analysis
Technical analysts use crypto chart patterns alongside confirmatory tools. Support and resistance levels reveal where price struggles to break through. Trend lines and momentum indices like volume, RSI, and MACD give an extra layer of trading signals.
After spotting a promising pattern on a chart of cryptocurrency data, traders search for confirmation signals before acting. This reduces risk and increases pattern reliability.
Common Crypto Chart Patterns Explained
Learning to identify key crypto trading patterns is essential for anyone wanting to trade smarter, not harder. Let’s break down both single-candle and multi-candle chart patterns crypto traders encounter regularly.
Single-candle patterns (short-term signals)
Single-candle crypto chart patterns provide rapid clues about market direction.
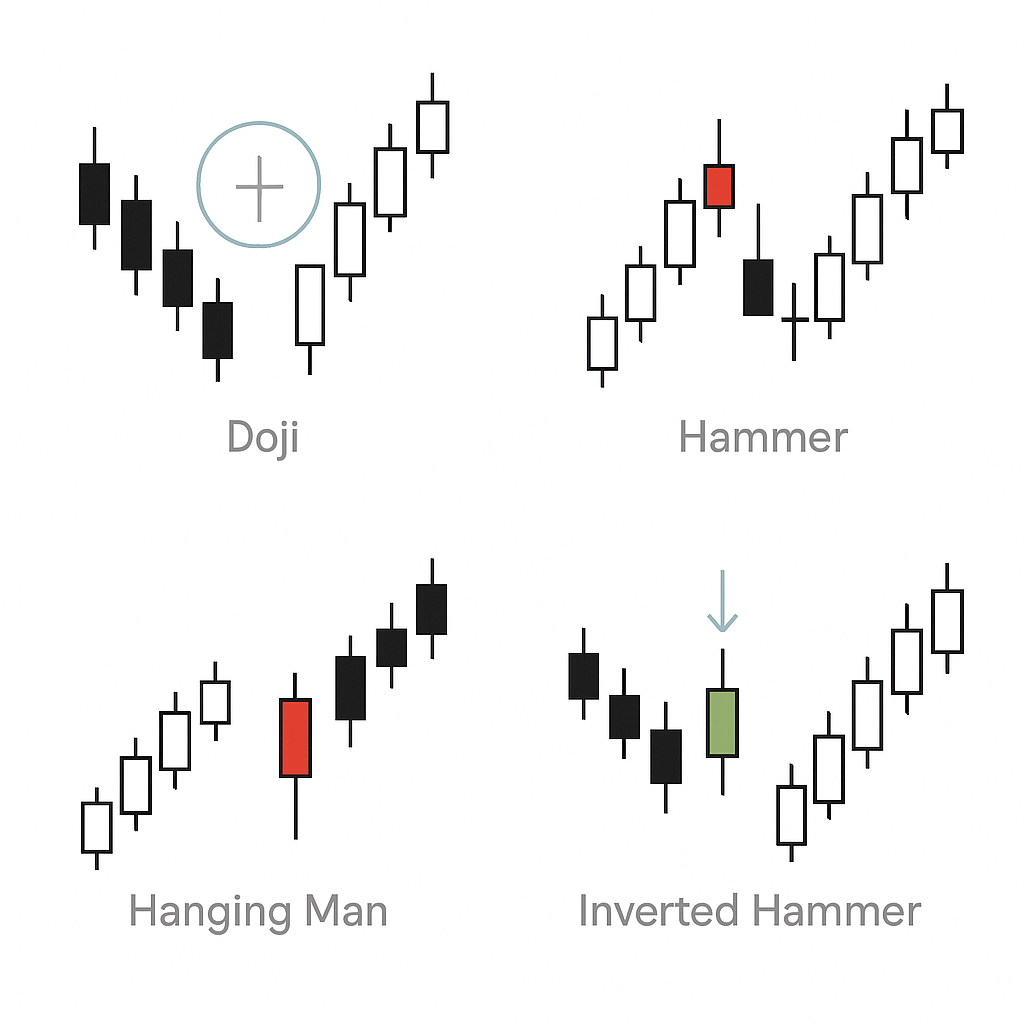
Doji: This pattern occurs when the open and close prices are nearly identical, forming a cross shape. A doji signals indecision—a potential trend reversal is likely if it appears after a strong move on a bitcoin candlestick chart.
Hammer and Hanging Man: Both have small bodies and long lower wicks. A hammer appears after a downtrend and signals a bullish reversal. The hanging man, at the top of an uptrend, warns of a bearish reversal.
Shooting Star and Inverted Hammer: The shooting star, found after an uptrend, has a small body and long upper wick—hinting at bearish reversal. The inverted hammer appears after declines, signalling bullish reversal.
Each of these crypto trading patterns is clearer and more powerful when combined with trading signals from technical analysis—like volume spikes or trend line support.
Read also: Shorting Cryptocurrency: The Fundamental Guide for Beginners
Multi-candle patterns (for all time frames)
Multi-candle crypto chart patterns provide more robust trading signals and are often used on bitcoin candlestick charts across different timeframes.
Head and shoulders / inverse head and shoulders
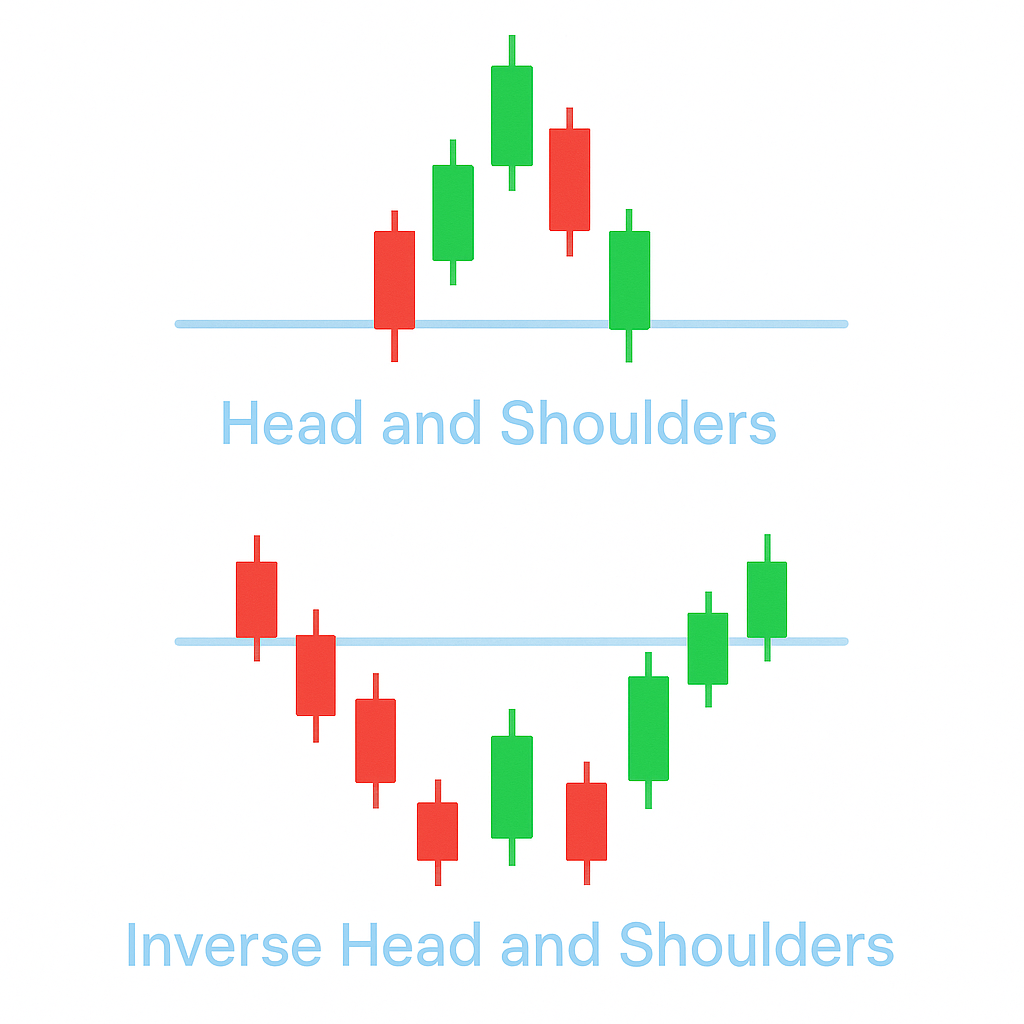
The head and shoulders pattern is a powerful bearish reversal signal. It forms with three peaks: a higher “head” between two “shoulders.” Once the neckline breaks, a price decline is expected. On a chart of cryptocurrency such as Bitcoin, this pattern is trusted for its high pattern reliability.
The inverse head and shoulders pattern is its bullish counterpart, signalling a strong reversal from downtrend to uptrend. Both are favoured by technical analysts for their clear entry and exit points.
Double top and double bottom
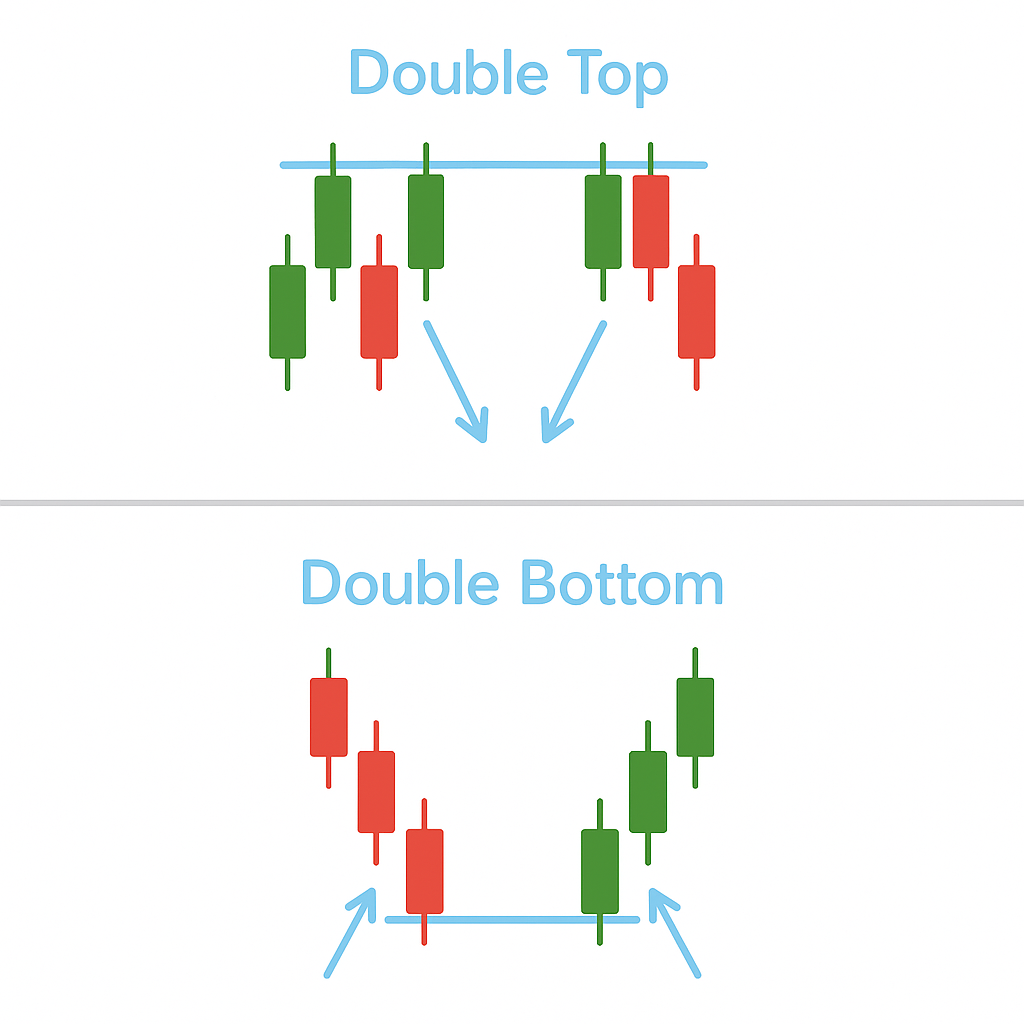
A double top forms when the price tests a resistance level twice but fails to break through, usually followed by a bearish reversal. A double bottom appears after downtrends, marking two failed pushes lower and a bullish reversal. These classic crypto chart patterns are very effective in both short-term and longer timeframes.
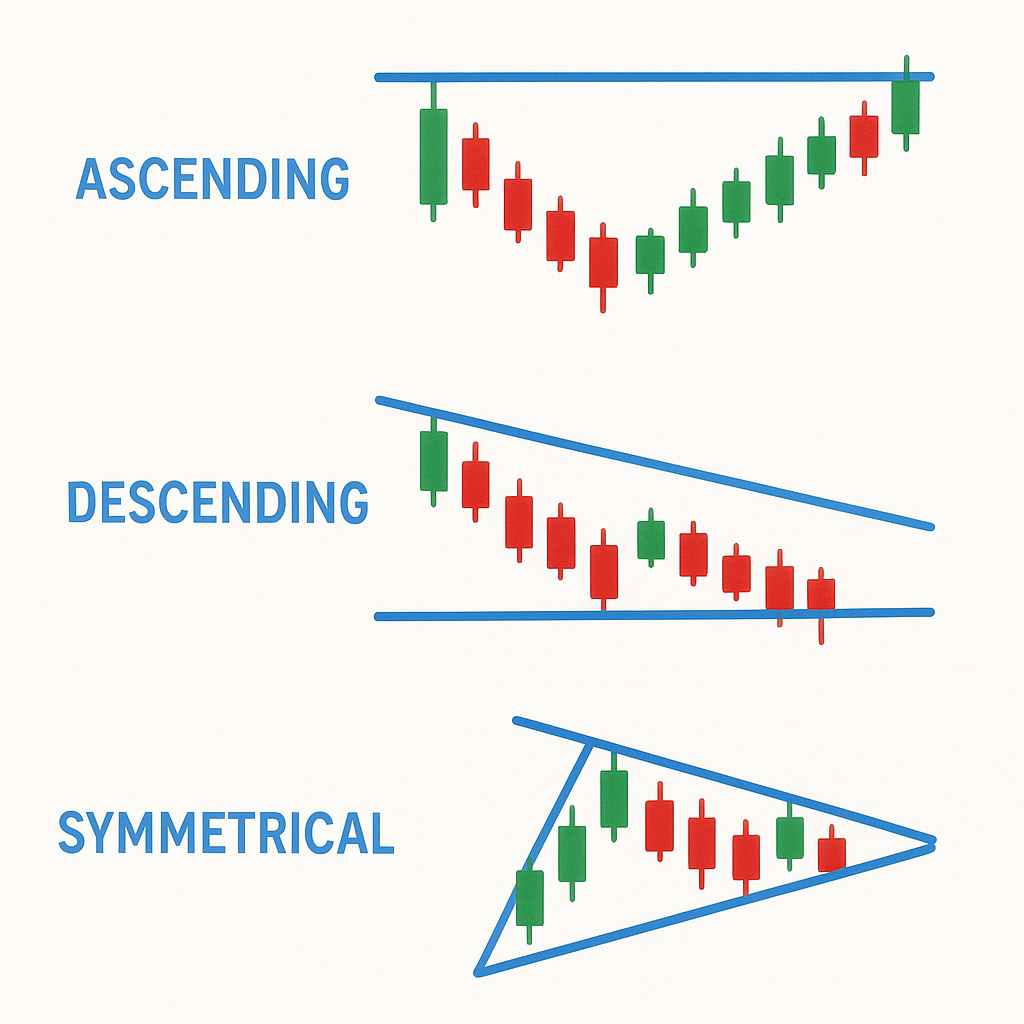
Triangles: ascending, descending, symmetrical
Triangles are among the most recognisable chart patterns crypto traders use. An ascending triangle forms with rising support and flat resistance, hinting at a bullish breakout. Descending triangles show falling resistance and flat support, indicating a bearish breakout. Symmetrical triangles show converging trend lines and usually precede strong moves in either direction.
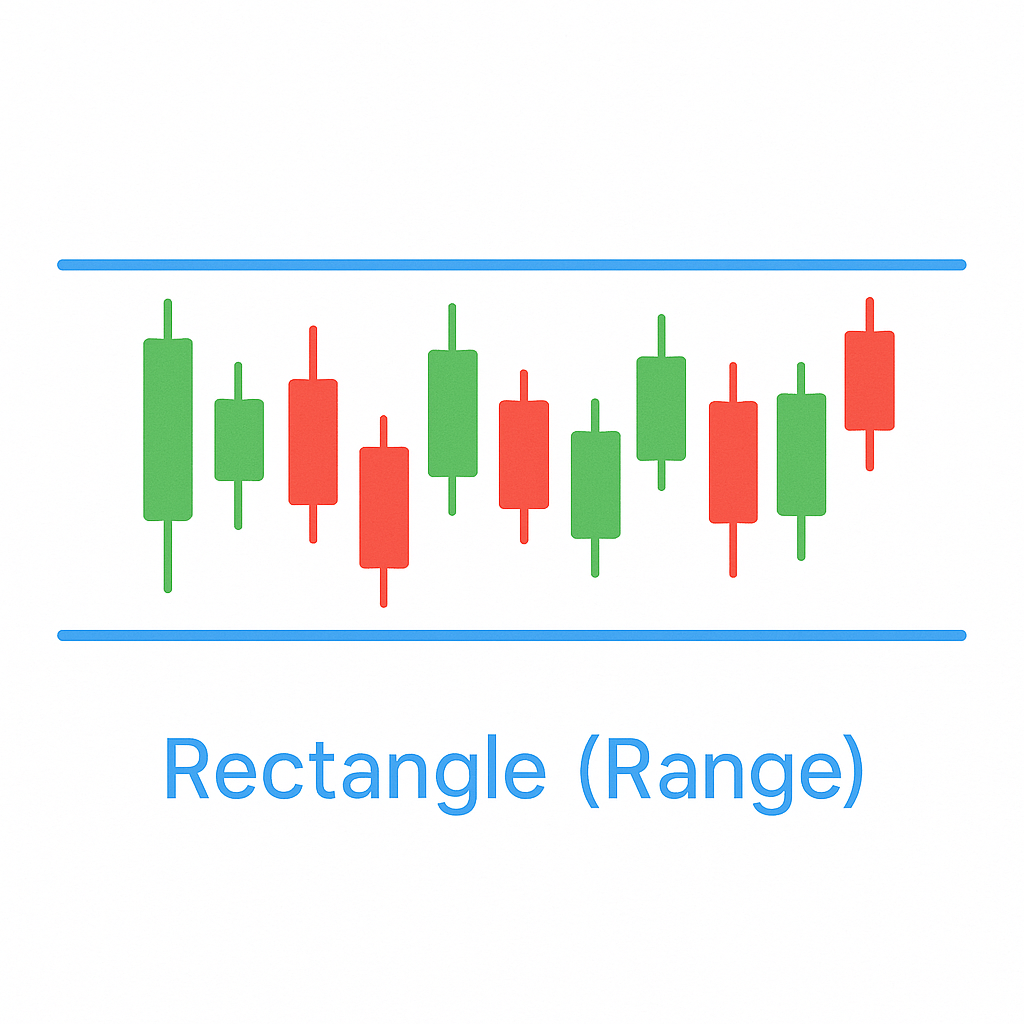
Rectangles (ranges)
Rectangles occur when price moves between parallel support and resistance, signalling market indecision. A breakout above or below the range signals the next trend direction. These are valuable on any chart of cryptocurrency, from hourly to daily charts.
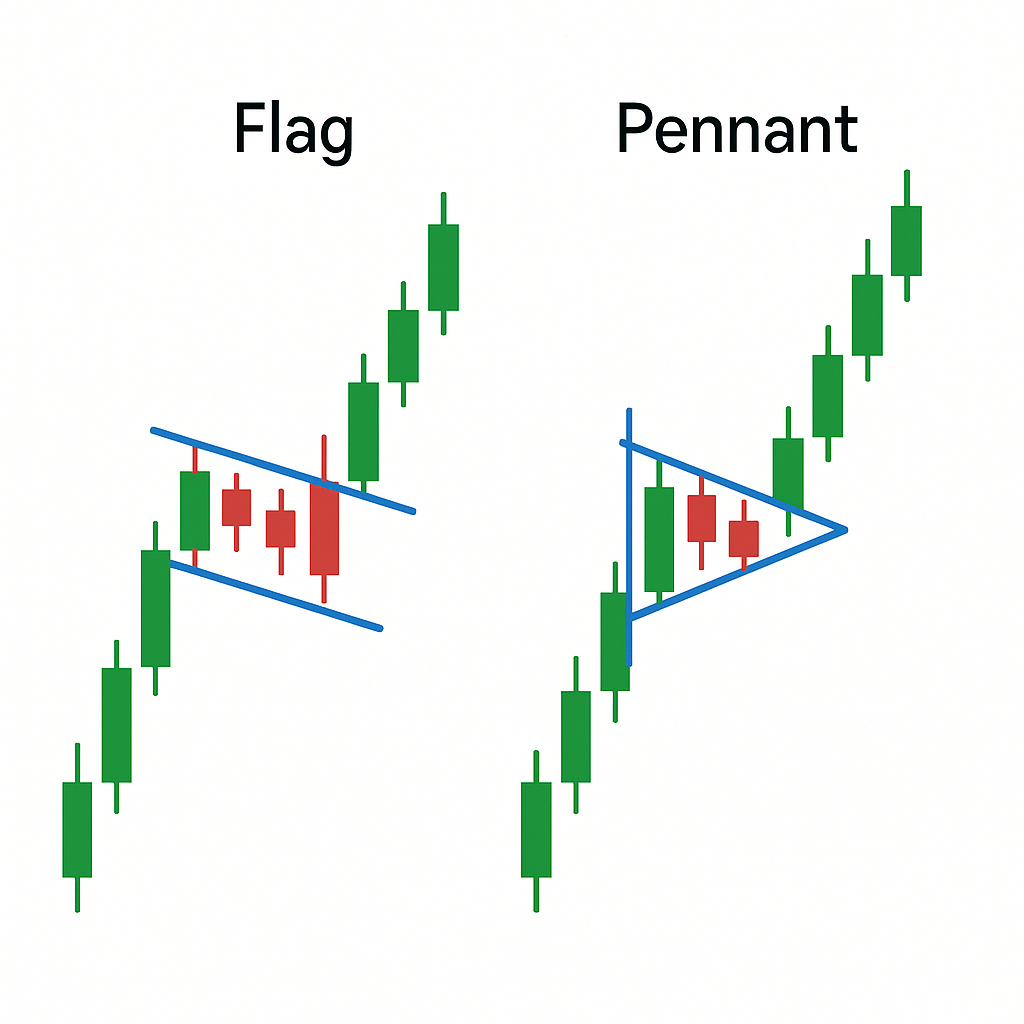
Flags and pennants (continuation patterns)
Flags are small rectangles sloping opposite to the prevailing trend, while pennants are tiny symmetrical triangles. Both are continuation patterns, signalling brief pauses before the trend resumes. Spotting these on bitcoin candlestick charts often precedes strong trend continuation.
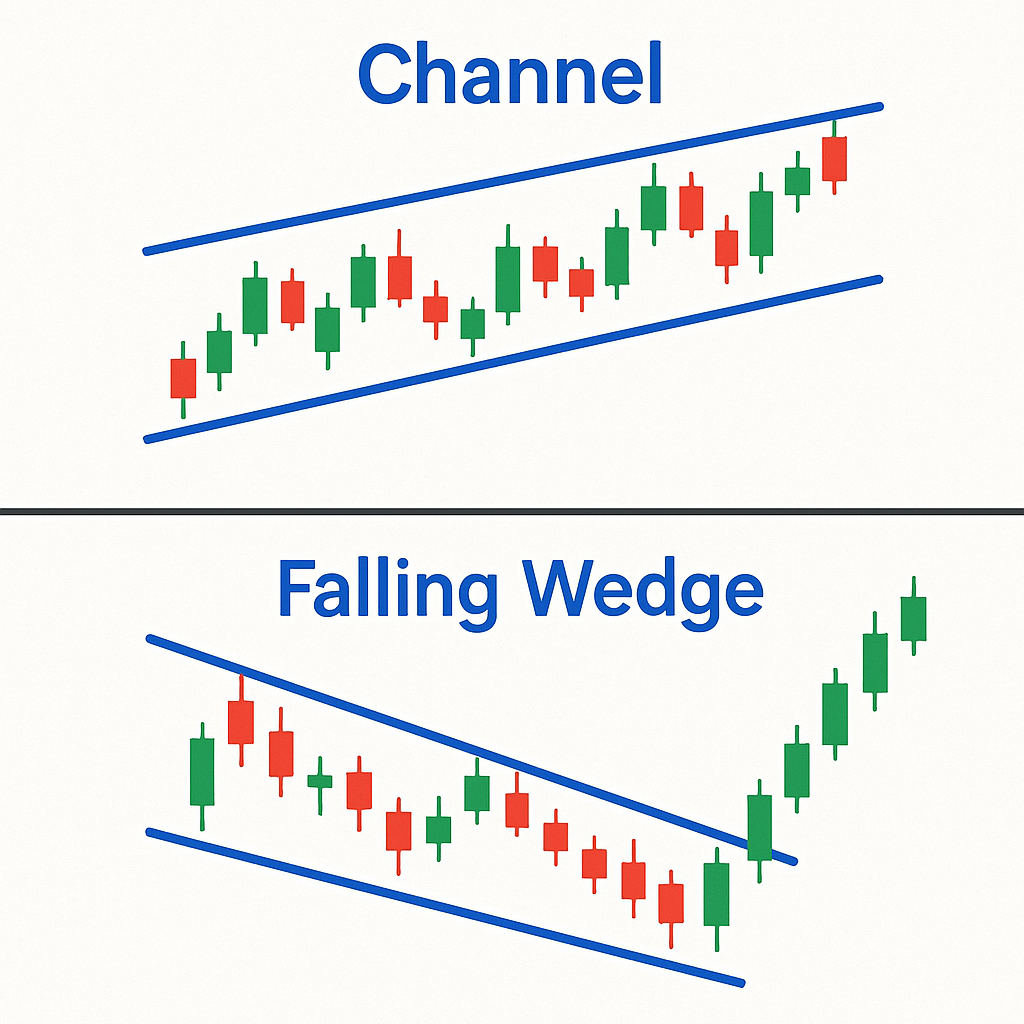
Channels and wedges
Channels are formed by parallel trend lines guiding price up (channel up) or down (channel down). Wedges are like slanted triangles, with falling wedges signalling bullish reversal and rising wedges pointing to bearish reversal. Pattern reliability increases with clear breakouts from the channel or wedge.
Tip: “Emerging” patterns are those still forming, whereas confirmed patterns have had breakouts with supporting volume or indicator confirmation.
How to Read Crypto Chart Patterns on Different Timeframes
Crypto charts can be analysed on various timeframes, each offering unique trading signals. Short-term charts (like 15-minute intervals) are best for day traders seeking quick opportunities. Hourly or 4-hour charts support medium-term trading decisions. Daily or weekly charts cater to long-term investors monitoring broader trends.
Reading chart patterns crypto enthusiasts rely on requires context. A double top on a 5-minute chart may signal a quick pullback, but the same pattern on a daily bitcoin candlestick chart suggests a more significant move.
Pattern reliability increases on longer timeframes because they capture more data, smoothing out noise. For example, a head and shoulders pattern confirmed on a daily chart of cryptocurrency is more reliable than on an intraday chart.
Combining Crypto Chart Patterns with Technical Indicators
Relying solely on chart patterns in cryptocurrency trading can lead to false signals. Enhance your trading success by combining crypto chart patterns with technical indicators.
RSI (Relative Strength Index): Measures momentum and overbought/oversold conditions. When a head and shoulders pattern aligns with an overbought RSI, bearish conviction is stronger.
MACD (Moving Average Convergence Divergence): MACD confirms momentum shifts. Spotting bearish divergence along with a double top pattern boosts pattern reliability.
Moving averages (SMA/EMA): Moving averages smooth trend data and generate support and resistance levels. A breakout above or below these averages, together with a flag or pennant, often confirms the pattern’s intent.
Volume: Increasing volume during breakouts from crypto chart patterns signals strength and confirms the trading signal.
Leading charting tools—such as TradingView, and CryptoCompare for instance—make overlaying these indicators seamless, improving technical analysis accuracy.
You may also like: How to Leverage Trading in Crypto
Practical Tips for Trading With Crypto Chart Patterns
Understanding crypto trading patterns is just the start—applying them wisely is crucial. Here are essential tips for using crypto chart patterns effectively:
Confirmation: Always wait for confirmation, such as a breakout with rising volume or supporting indicator signals, before acting on a pattern.
Risk management: Use stop-loss orders and position sizing to limit your risk. Risk/reward ratios should match the pattern’s success rate and timeframe.
Pattern reliability: Some chart patterns crypto traders use are more dependable than others. Inverse head and shoulders, channels, and falling wedges have a higher success rate for beginners.
Adapting strategies: Markets change. Blend pattern analysis with broader trend analysis and macro events impacting cryptocurrency prices.
Avoid over-reliance: Patterns work best as part of a broader technical analysis framework, not in isolation. Consider support and resistance, volume trends, and global news for a well-rounded approach.
Best Tools and Resources for Analysing Crypto Chart Patterns
Mastering chart patterns crypto traders trust is much easier with the right tools. Here’s where to start:
TradingView: Industry-standard free and paid charting. Offers technical analysis tools, bitcoin candlestick chart overlays, and automated pattern recognition.
Coinigy, CryptoCompare: Popular platforms with robust charts of cryptocurrency libraries and community trading ideas.
Pattern Recognition and Cheat Sheets: Many platforms provide pattern auto-detection using AI (e.g., altFINS). Keep cheat sheets and reference guides handy.
Practise Tools: Explore demo accounts and backtesting on platforms or use chart replay features to gain confidence.
Stay updated with ICONOMI’s crypto blog, where you’ll find fresh tutorials and walkthroughs for analysing crypto trading patterns.
Conclusion: Start Practising With Crypto Chart Patterns
Learning crypto chart patterns is a powerful way to understand cryptocurrency trends and price action. But trading alone can be complex and time-consuming, especially for new investors.
Rather than focusing solely on high-frequency trading, ICONOMI lets you benefit from expert-selected crypto strategies through copy trading. You can follow top performing crypto traders, diversify portfolios, and access markets 24/7—all without deep technical expertise.
Moreover, safety and reliability come first at ICONOMI. Our platform offers secure asset management and transparent performance data, giving you peace of mind as you invest and learn.
By combining ICONOMI’s easy-to-use copy trading, robust security, and reliable service, you can apply your chart analysis at your own pace, or leverage experienced managers to guide your crypto journey. Explore ICONOMI today and invest smarter, not harder.

Ready to start your journey with us?
Trusted by over 100,000 users from around the world.
