
Crypto Weekly Wrap: 7th November 2025
From Extreme Fear to a Glimmer of Inflow: Crypto's Uneasy Equilibrium
This past week felt like the market was trying to decide if it wanted to go for a swim or just tread water, but ended up doing a bit of both, albeit in a somewhat chilling pond. We’ve been living in the realm of "Extreme Fear" for crypto, a place where headlines look grim and every dip feels like a personal affront. Bitcoin dipped below $100,000, Ethereum struggled, and altcoins, well, they largely followed suit. Yet, just as the gloom seemed to settle in, a notable reversal in ETF flows provided a flicker of optimism, raising the question: Is the market finding its footing, or just catching its breath before the next uncertain plunge?
The Macro Lens
The broader economic landscape remained the persistent, slightly damp blanket over the crypto market. The Federal Reserve's continued hawkish posture, coupled with a general macroeconomic uncertainty and a global economic slowdown, kept risk assets, including cryptocurrencies, under pressure. Think of it like a giant, invisible hand gently but firmly pushing down on anything deemed speculative. High inflation numbers, rising yields, and geopolitical tensions haven't exactly rolled out the red carpet for risk-taking.
This cocktail of traditional finance anxieties was a primary driver for the Crypto Fear & Greed Index to plunge into "Extreme Fear" territory (a truly uncomfortable 21 on November 4th), as investors naturally gravitated towards safer havens. The good news? That index has since nudged up a little, to a less terrifying (but still cautious) 27, suggesting perhaps we've seen the worst of the immediate panic, for now.
The Crypto Lens
In the crypto trenches, it was a week of trying to hold the line.
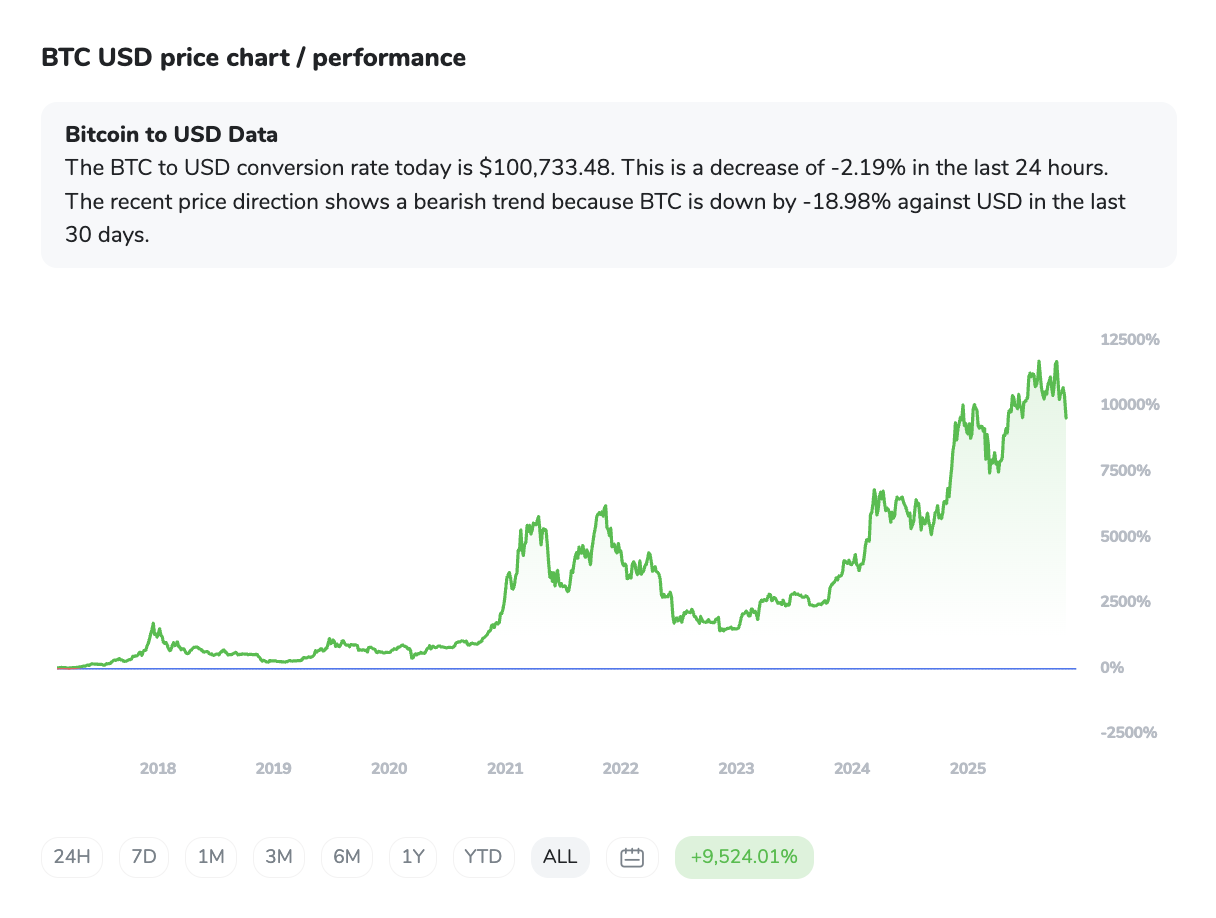
Bitcoin (BTC)
Bitcoin (BTC), currently trading at $100,685 (down 2.25% in the past 24 hours), has been navigating a volatile stretch, briefly dipping below the key psychological $100,000 mark before staging a modest recovery. The $100,000 level remains a crucial battleground, with established support around $93,000 and resistance looming near $105,000. Technical indicators point to a cautious outlook as BTC clings to these critical zones
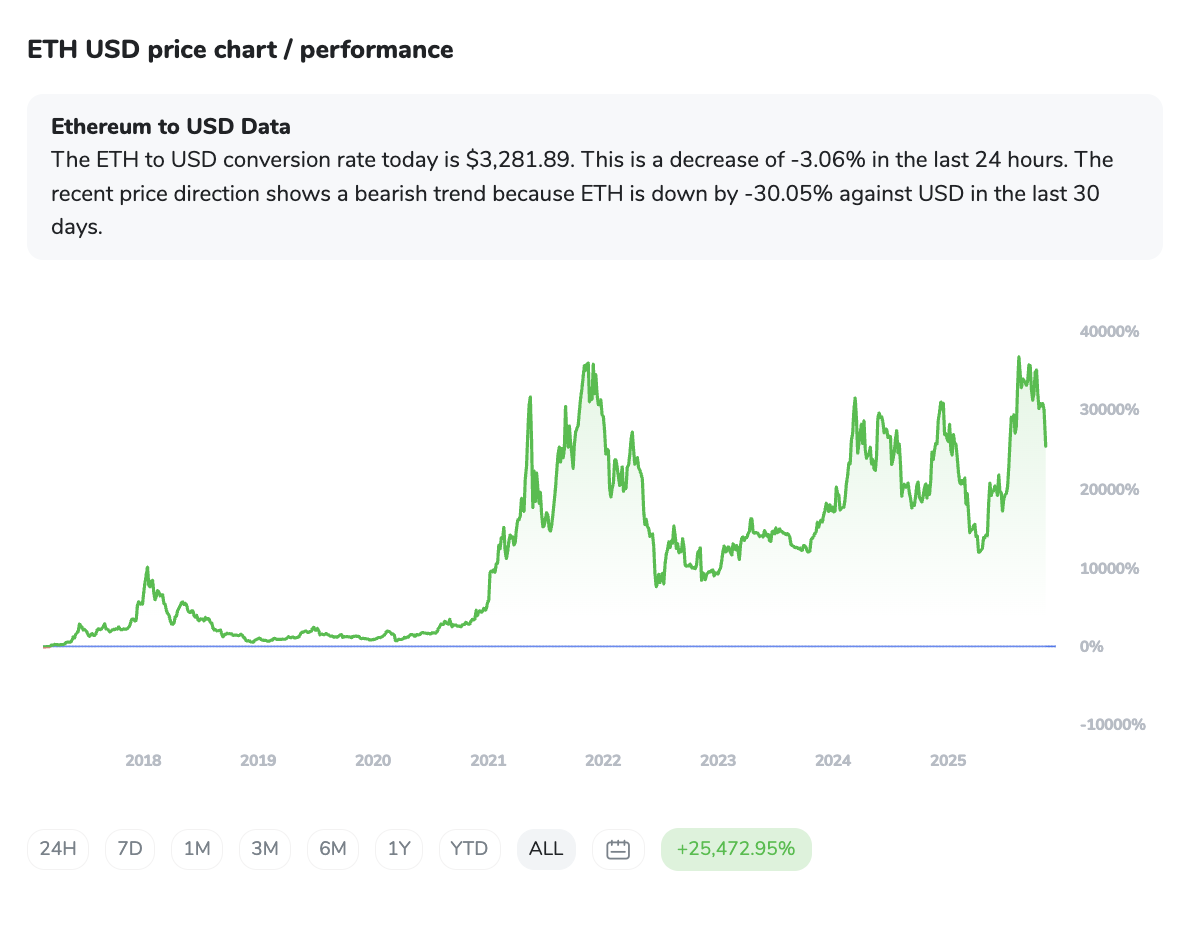
Ethereum (ETH)
Ethereum (ETH) is currently trading at $3,280.71, down 3.16% in the past 24 hours, following a similar narrative of downward pressure. The asset recently retested a longer-term uptrend line that now serves as critical support, with key levels between $3,166 and $3,300. On-chain data shows some holders reducing exposure, either a sign of caution or strategic rebalancing, while resistance remains overhead around $3,800 to $3,900
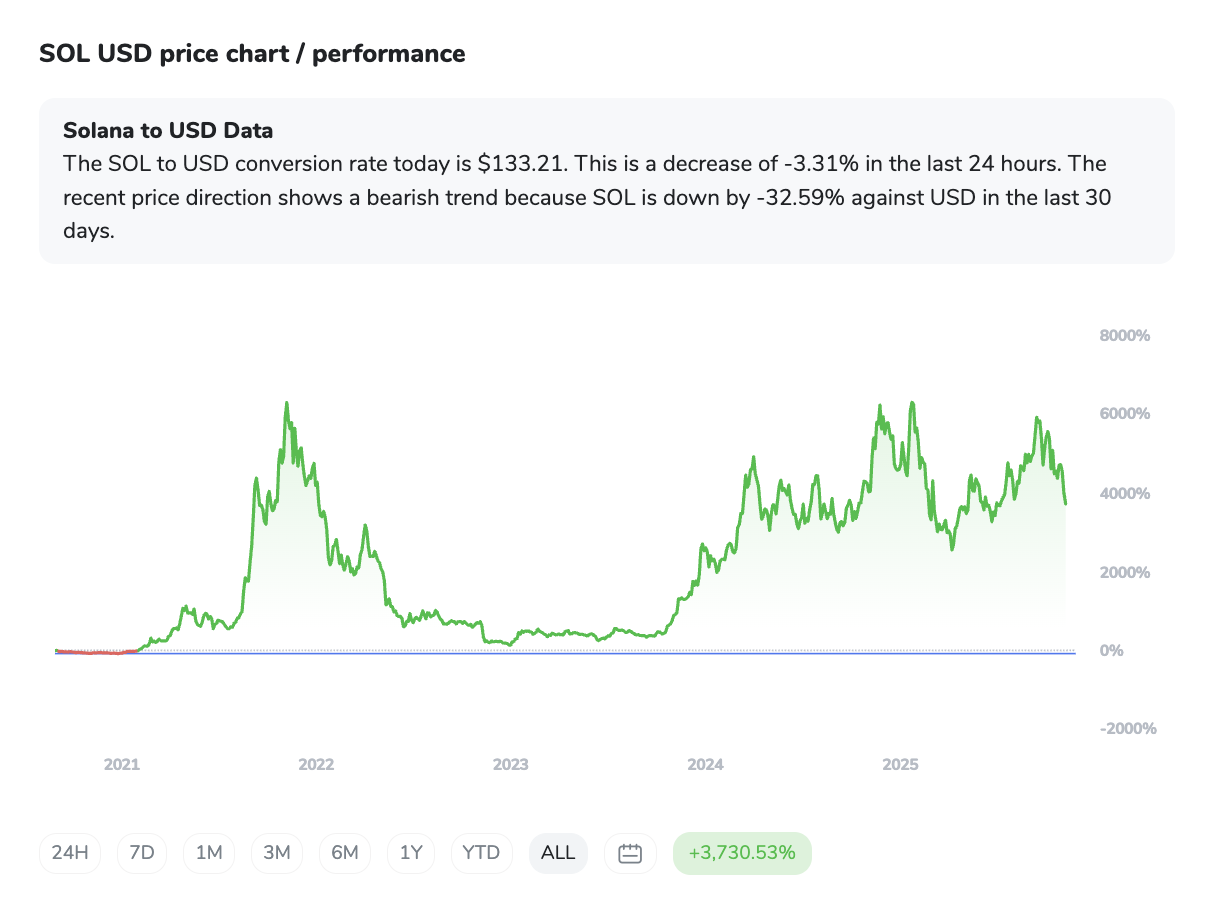
Solana (SOL)
Solana (SOL) is trading at $154.54, down 2.84% in the past 24 hours, presenting a mixed technical picture. The asset is moving within a “falling wedge” pattern, a setup that can precede a bullish reversal, but its recent break below the crucial $170–$180 support zone points to continued bearish momentum. Exchange outflows have added to the selling pressure, with immediate support seen around $146–$157 and resistance beginning at $168–$174.
The biggest crypto development came from ETFs, which finally reversed their six-day outflow streak on November 6. After over $2 billion leaving Bitcoin and $837 million exiting Ethereum ETFs, inflows returned: BlackRock’s IBIT added $112 million, Fidelity’s FBTC $61.6 million, and Ark Invest’s ARKB $60.4 million. Ethereum ETFs followed, with ETHA gaining $8 million and FETH $4.94 million. Even Solana’s new ETFs stayed positive, logging $29.2 million in inflows. The shift from red to green hints that institutions either see the worst as over, or view current prices as too attractive to ignore.
The ICONOMI Angle
Amidst the market's nervous jitters, a look at ICONOMI's top-performing strategies offers a valuable glimpse into how professional approaches navigated the week. It’s clear that a blend of strategic allocation and nimble management was key.
Asymmetry Active Performance delivered an impressive +5.78% weekly return. Its composition, leaning heavily into USDT (65.09%) while maintaining a significant BTC (34.91%) exposure, proved a potent combination. The substantial stablecoin position likely acted as a robust defensive buffer against broader market downturns, allowing the BTC allocation to capture any upward swings efficiently.
Metastrategy also showed resilience with a +2.81% return. Its diversified approach across a wide array of cryptocurrencies, including Zcash (26.98%), ETH (24.20%), SOL (13.48%), and BTC (11.25%), demonstrates the power of spreading risk. Even with some assets facing headwinds, the overall balance found positive traction.
Even strategies like Pecun.io Cryptocurrency and HODLers, despite ending the week with slight negative returns of -1.09% and -0.56% respectively, showcased different risk profiles. Pecun.io's substantial allocations to PAXG (50.56%) and USDC (25.15%) largely mitigated the impact of its BTC exposure. And for HODLers, even a 100% USDC strategy isn't entirely immune to the subtle frictions and minor tracking variations of a volatile market, illustrating that even sitting on the sidelines requires careful consideration.
These results underscore that in a cautious market, a well-thought-out strategy, often involving significant stablecoin allocations, can be the difference between merely surviving and subtly thriving.
What to Watch Next
The market finds itself at a peculiar crossroads, poised between macroeconomic apprehension and tentative signs of institutional re-engagement. Here’s what discerning investors should monitor in the weeks ahead:
Sustained ETF Inflows: Can the November 6th reversal for Bitcoin and Ethereum ETFs signal a lasting shift, or was it just a blip? Consistent inflows will be a strong indicator of returning institutional confidence.
Federal Reserve Commentary & Rate Decisions: Any clearer signals regarding potential U.S. interest rate cuts would act as a powerful catalyst, potentially injecting liquidity back into riskier assets like crypto. Conversely, continued hawkishness would likely renew pressure.
Key Technical Levels: Watch Bitcoin’s ability to hold above $100,000 and Ethereum’s performance around its retested support at $3,166-$3,300. Breaks below these could signal deeper corrections.
Regulatory Developments: Progress on U.S. regulatory clarity, such as the GENIUS Act, or discussions around staking functionality for spot Ethereum ETFs, could provide significant tailwinds.
Altcoin ETF Progress: The consistent inflows into Solana ETFs are noteworthy. Keep an eye on any chatter around potential spot ETFs for other altcoins like XRP, which could unlock new capital flows.
Geopolitical Stability: Global tensions remain a wild card. Any escalation could quickly send investors scurrying from risk assets.
Market Leverage: High leverage in the system can amplify price swings. Monitor on-chain metrics for signs of excessive leverage that could lead to rapid liquidations during downturns.
FAQs
Why was market sentiment so negative this week, despite some assets holding support?
The overall sentiment plummeted due to persistent macroeconomic uncertainty, including a hawkish Federal Reserve stance, global economic slowdown concerns, and geopolitical tensions. This created a "risk-off" environment, making investors wary of speculative assets like crypto, leading to the Crypto Fear & Greed Index hitting "Extreme Fear."
What happened with Bitcoin and Ethereum ETFs, and why is it important?
Spot Bitcoin and Ethereum ETFs experienced a significant six-day streak of outflows, indicating institutions were pulling capital out. However, on November 6th, this trend reversed, with both seeing renewed net inflows. This is crucial because it suggests a potential return of institutional interest and capital, possibly indicating a belief that recent price corrections represent buying opportunities, and could stabilize the market.
Is Solana looking bullish or bearish right now?
Solana presents a mixed picture. On one hand, it's in a "falling wedge" pattern, which technically could signal a bullish reversal. On the other hand, it recently broke below a key support zone ($170-$180), which traditionally suggests further bearish continuation. The positive is that Solana spot ETFs have consistently seen net inflows since their launch, indicating sustained institutional interest despite price volatility.

Ready to start your journey with us?
Trusted by over 100,000 users from around the world.
