
Crypto Weekly Wrap: 1st August 2025
The Tug-of-War: Macro Headwinds vs. Crypto's Stubborn Streak
This past week in crypto felt like a particularly spirited game of 'tug-of-war' between an unyielding macroeconomic environment and a digital asset market determined to write its own script. Just when we thought we had a handle on things, the market threw us a curveball, with significant dips across Bitcoin, Ethereum, and Solana on August 1st. Yet, beneath the surface of this general market retreat, some interesting narratives are emerging – particularly the curious case of diverging institutional appetite for Bitcoin vs. Ethereum ETFs. Let's unspool the threads.
The Macro Lens
The broader financial markets spent the week wrestling with familiar foes: persistent inflation fears and the implications of a potentially prolonged period of high U.S. interest rates. Adding to the unease were new U.S. tariffs, which often act as a dampener on global trade sentiment. These factors, as one might expect, tend to steer investors toward 'risk-off' positions, pulling capital from assets perceived as more volatile.
For crypto, this macro backdrop acted like a strong headwind. The general market capitalization took a notable hit, declining by 6.6% on August 1st alone. It's a classic example of traditional finance's tremors rattling the nascent crypto space, reminding us that even decentralised assets aren't entirely immune to the gravity of global economic policy.
The Crypto Lens
On the crypto front, it was a week of nuanced movements rather than clear trends, a bit like watching a very active but ultimately stationary ballet.
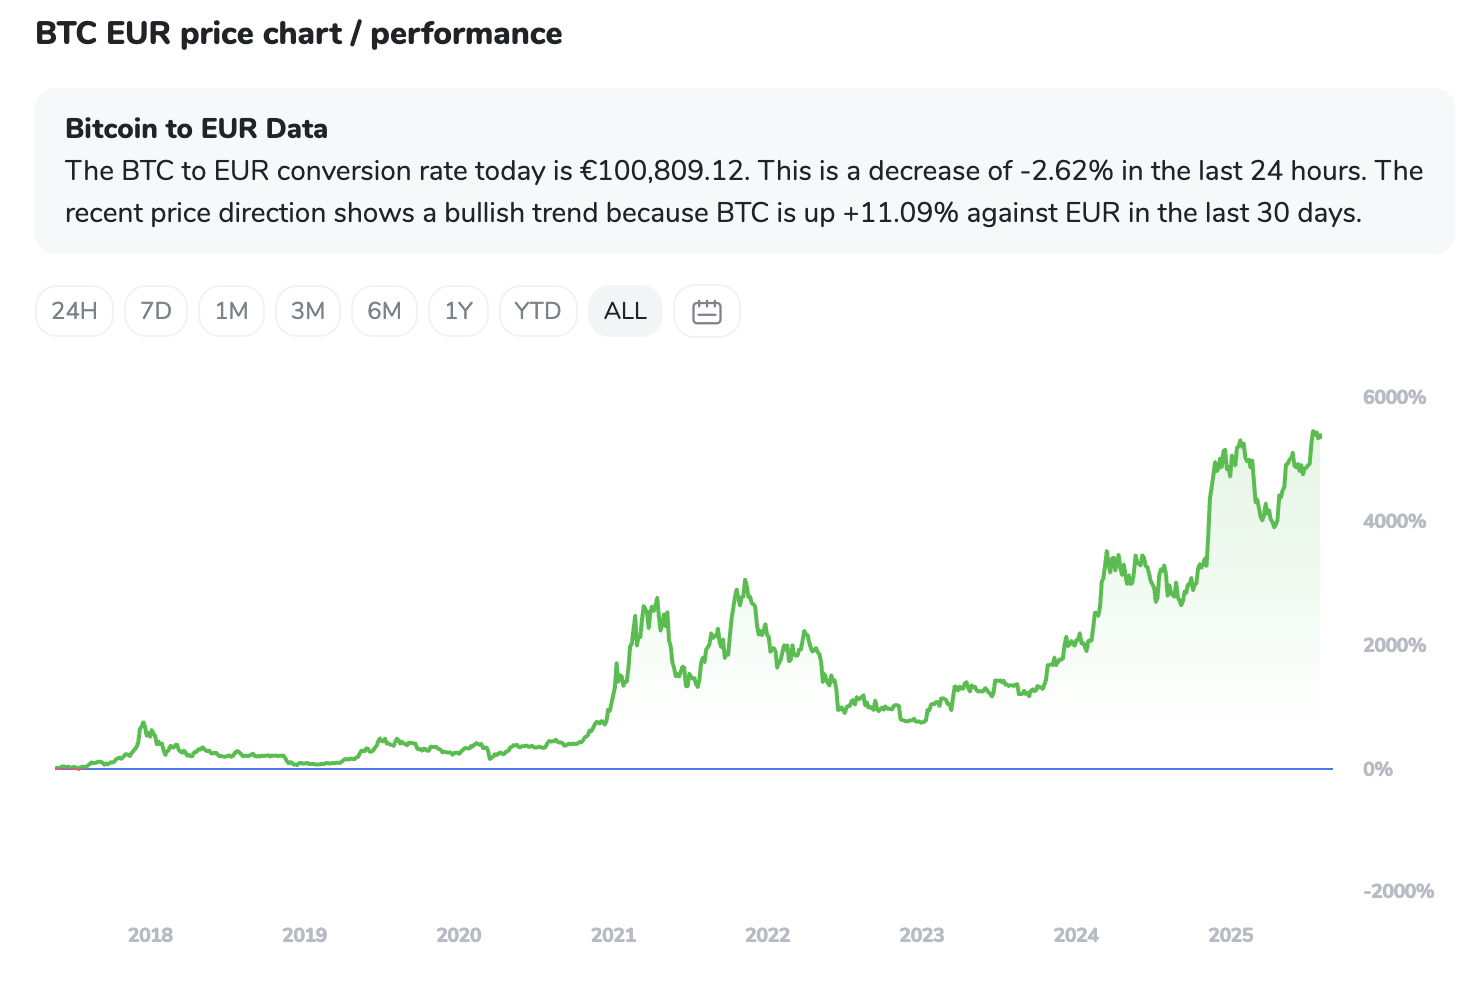
Bitcoin (BTC) found itself in an 18-day consolidation phase, hovering stubbornly between $115,000 and $121,000. While the broader market dipped, Bitcoin largely clung to its range, currently sitting around $115,163 with a 24-hour dip of 2.82%. Analysts are eyeing $120,000 as the critical breakout point, requiring sustained positive volume in both spot and futures markets. Think of it as Bitcoin gathering its breath, deciding whether to make a run for $128,000 or retreat to stronger support.
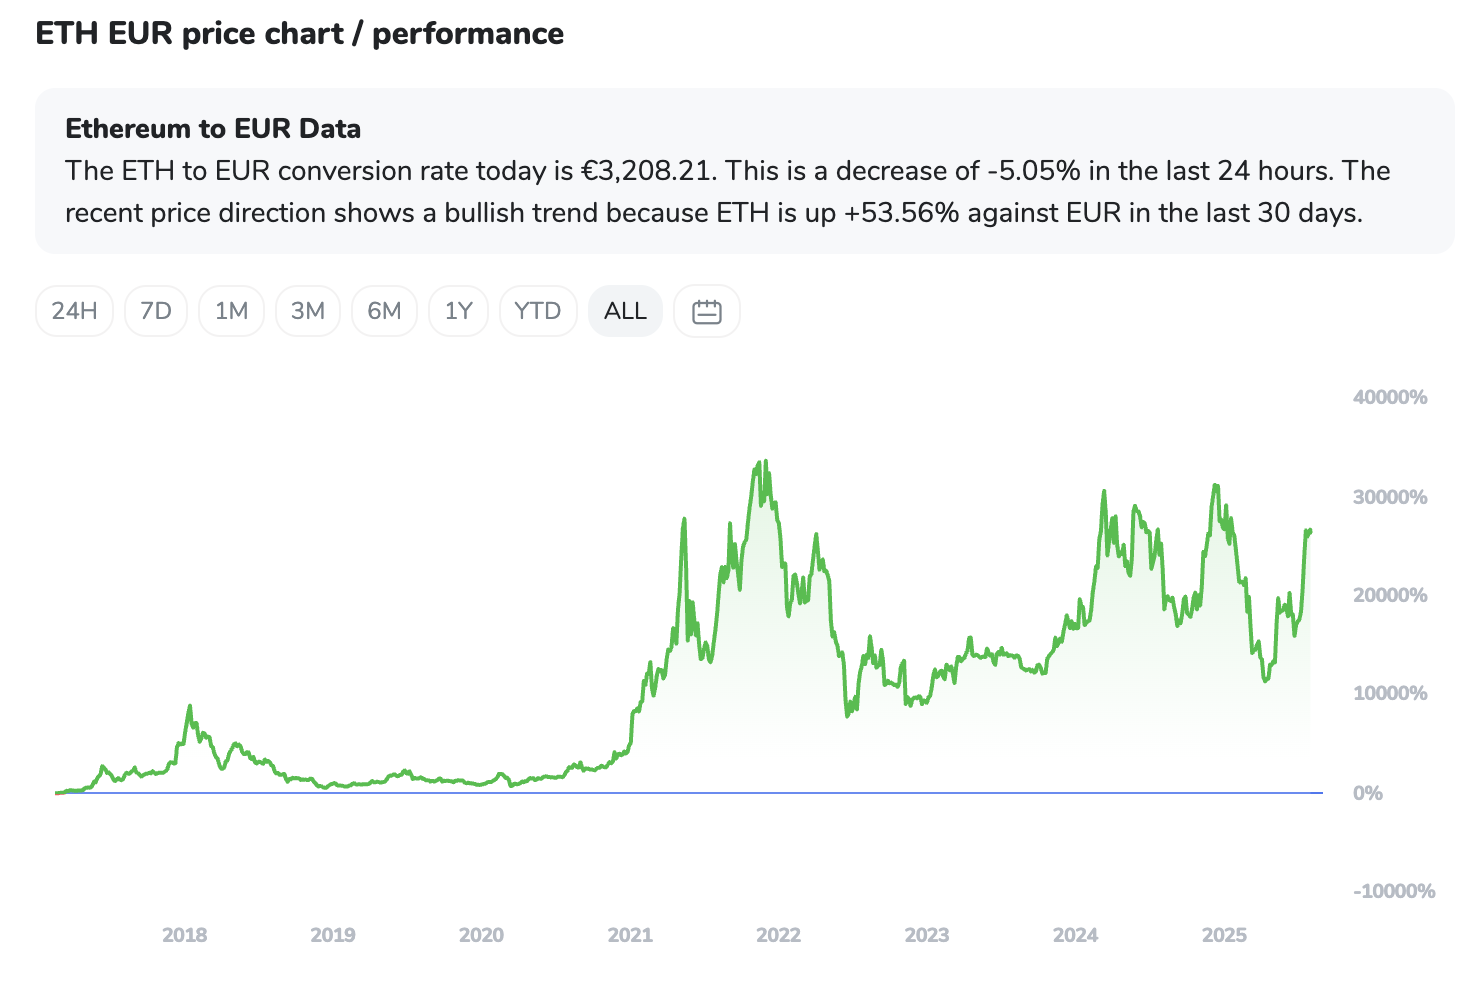
Ethereum (ETH), meanwhile, put on a more dramatic performance. Despite a 5.5% 24-hour decline to $3,653.09, the underlying sentiment remains stubbornly bullish. Ethereum had previously muscled its way above the $3,800 mark, converting old resistance into new support. Technical indicators, for those who consult them, are largely flashing green, suggesting upward pressure. The chatter suggests a move past $4,100 could quickly see it targeting $4,250, a potential retest of what was once a critical structural pivot at $4,500. It's almost as if Ethereum believes it's on a different economic continent.
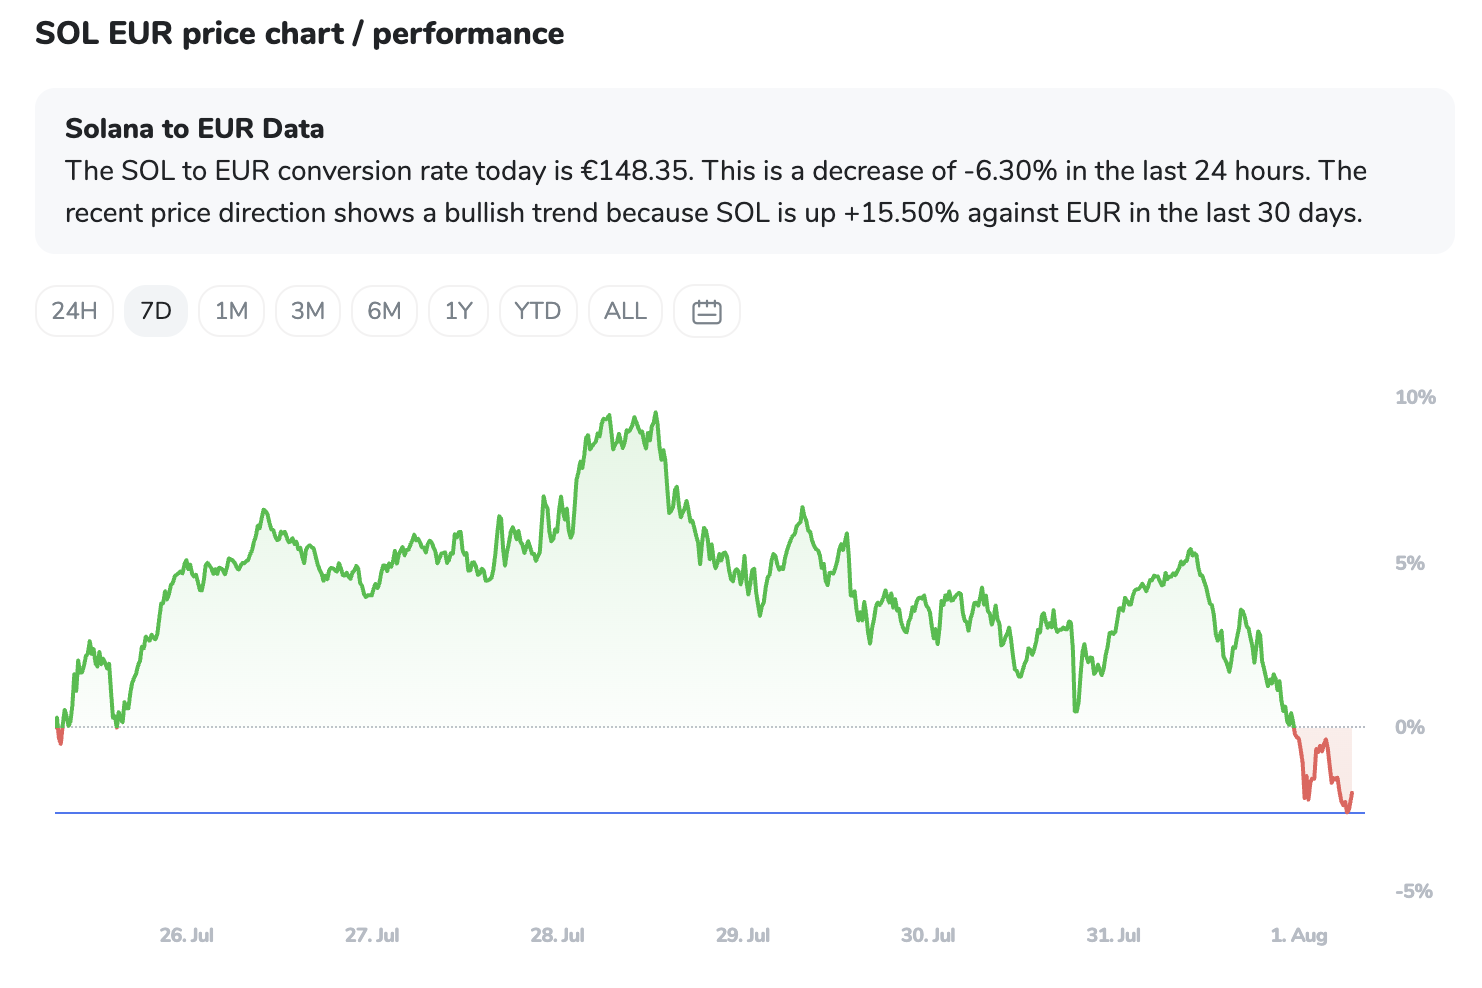
Solana (SOL), at $168.5 and down 6.8% in 24 hours, also felt the downdraft. It’s been carving out a 'descending wedge' pattern, a technical term for when an asset keeps making lower highs and lower lows, but with the range narrowing. It's currently testing a critical support level around its 20-day Exponential Moving Average (EMA) at $178. Like a coiled spring, a decisive close above $188 could see Solana aiming for $195-$200.
Perhaps the most compelling story of the week comes from the ETF flows. July was a watershed month for **US spot Ethereum ETFs**, which saw a staggering *record-breaking $5.4 billion in net inflows*. This is not a typo. Funds like BlackRock's ETHA and Fidelity's FETH were pulling in tens of millions. This tells us institutional players are not just dipping their toes; they're taking a full plunge into Ethereum.
In stark contrast, spot Bitcoin ETFs experienced a net outflow on August 1st, breaking a five-day streak of positive inflows. While some, like BlackRock's IBIT, still saw inflows, giants like ARK's ARKB and Fidelity's FBTC registered significant outflows. This divergence is fascinating: while the macro environment pushed some Bitcoin investors to the sidelines, institutional conviction in Ethereum appears to be hitting new highs. It's as if they're saying, 'Yes, the market is volatile, but *this* particular digital asset is still undervalued.'
Overall market sentiment, measured by the Crypto Fear & Greed Index, remains in 'Greed' at 75, but it did tick down from a recent peak. This suggests a bit of caution is creeping back in, with some analysts even suggesting we might be entering a correction phase. The market is effectively trying to decide if it's time for a cool-down or if the institutional love for ETH can reignite the broader rally.
The ICONOMI Angle
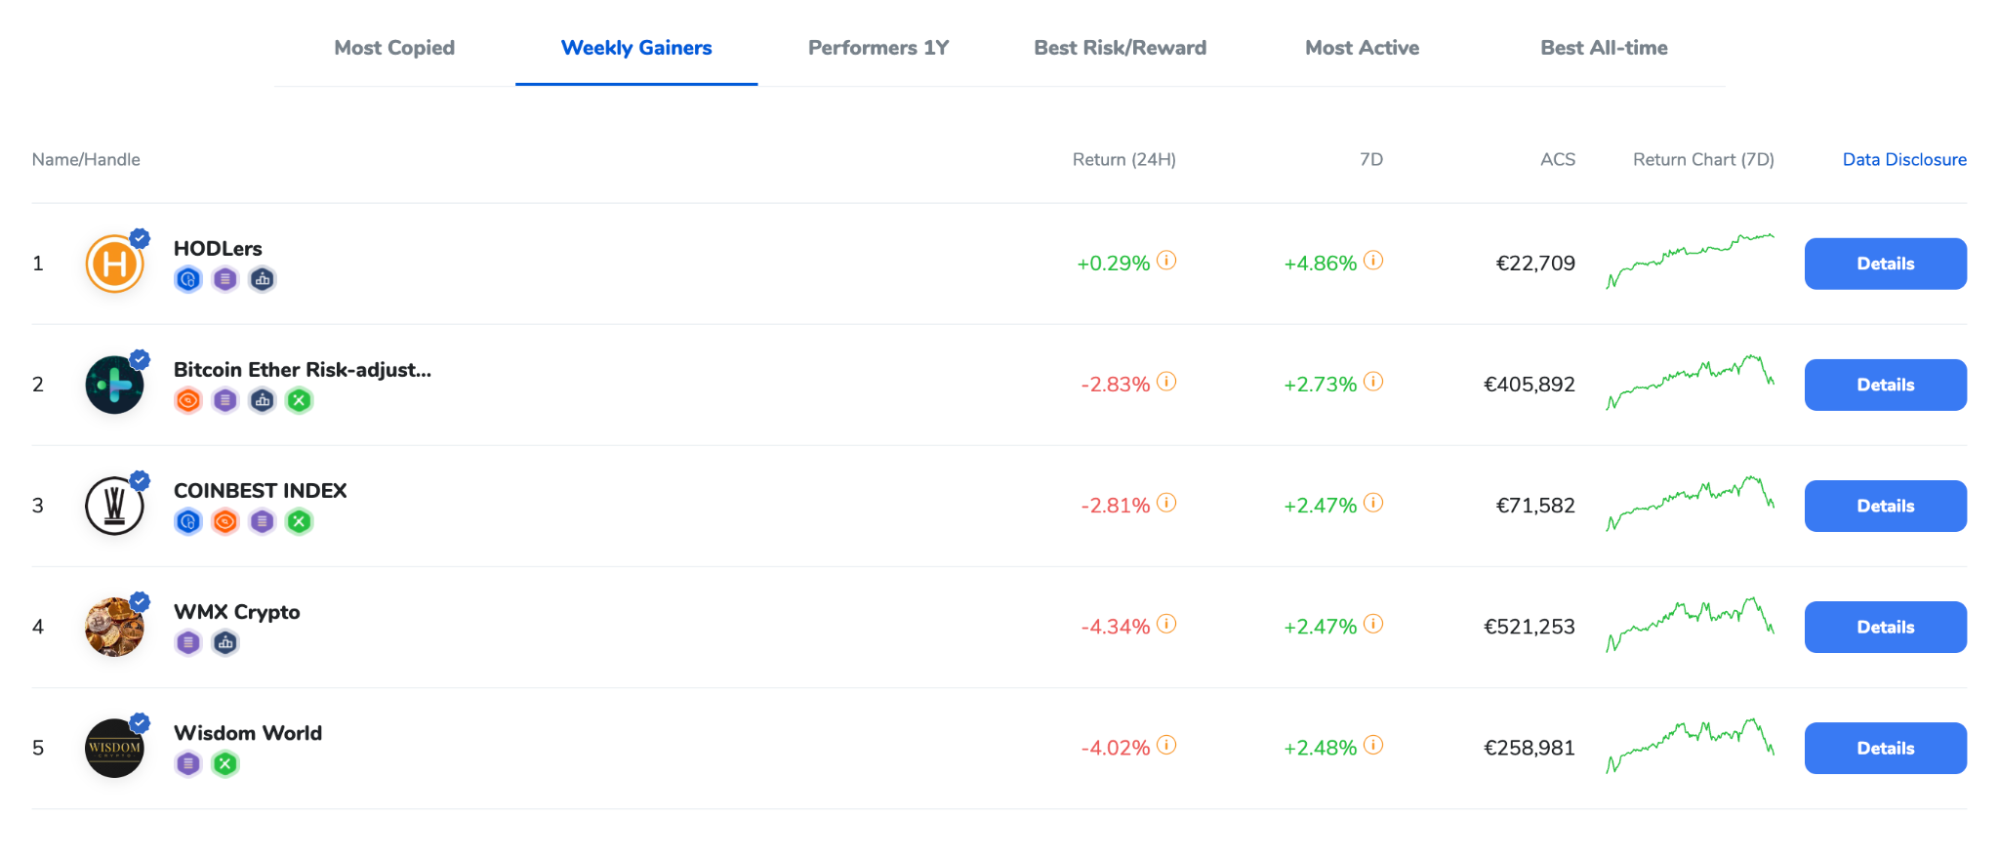
In a week that saw broad market dips, our ICONOMI strategies offered a fascinating look at how different approaches weathered the storm. The standout performer was HODLers, which notched an impressive +4.81% weekly return by virtue of being 100% in USDC. This perfectly illustrates the power of stablecoins in a volatile period – sometimes, the best offence is a good defence, and sitting in cash can look like genius when other assets are retreating. It’s the equivalent of having your umbrella up before the rain hits.
Beyond the stablecoin haven, the other top performers showcased the resilience of diversified crypto portfolios. Strategies like Bitcoin Ether Risk Adjusted (+2.69%) and COINBEST INDEX (+2.43%) proved that a core allocation to Bitcoin and Ethereum, often alongside some strategic diversification (like PAX Gold in COINBEST), can still deliver positive returns even when the broader market is feeling the squeeze. Wisdom World (+2.33%) and WMX Crypto (+2.25%) further underlined this, with their blend of BTC, ETH, and select altcoins like SOL, AVAX, FET, and INJ providing a buffer against the daily price swings.
What this tells us is that while headlines scream about market dips, well-managed strategies, particularly those with a thoughtful allocation to core assets or a defensive stablecoin stance, can still find alpha. It's not about avoiding all volatility, but about having a framework that allows you to capture gains and mitigate losses.
What to Watch Next
As we peer into the week ahead, here’s what's worth keeping an eye on, without resorting to crystal balls:
The Macro Chess Game: Will inflation data or central bank rhetoric provide any relief, or will the 'higher for longer' interest rate narrative continue to weigh on risk assets? Keep an eye on any further policy announcements that could shift the risk-off sentiment.
Ethereum's Institutional Momentum: Can US spot Ethereum ETFs maintain their staggering inflow momentum? Continued strong performance here would be a powerful signal of sustained institutional adoption, potentially acting as a floor or even a catalyst for ETH.
Bitcoin's Breakout Bid: Is Bitcoin truly consolidating for a larger move, or is it just holding its breath before a deeper correction? A decisive daily close above $120,000, backed by healthy volume, would be a significant bullish signal. Conversely, a fall below key support levels would prompt a re-evaluation.
Altcoin Correlations: Will altcoins continue to dance to their own beat, or will they snap back into tighter correlation with Bitcoin and Ethereum? Solana's technical setup, for example, bears watching as a bellwether for broader altcoin strength.
Sentiment Shift: Monitor the Fear & Greed Index. A sustained drop could signal capitulation and potential buying opportunities, while a rebound to extreme greed might suggest a short-term peak.
FAQs
Why did the crypto market dip on August 1st despite positive Ethereum ETF news?
The August 1st dip was largely influenced by broader macroeconomic pressures, specifically concerns over prolonged high U.S. interest rates and new U.S. tariffs. These global economic jitters often lead investors to reduce their exposure to riskier assets like cryptocurrencies. While Ethereum ETFs saw significant inflows, indicating strong institutional conviction in ETH, the overall market often reacts to these larger macro currents, overriding asset-specific good news in the short term.
What's the significance of the divergence in Bitcoin and Ethereum ETF flows?
This divergence suggests a maturing market where institutional investors are becoming more selective. While Bitcoin ETFs experienced outflows due to macro anxieties, record inflows into Ethereum ETFs indicate a growing, targeted institutional belief in Ethereum's long-term value proposition and utility. It implies that smart money might be de-correlating assets based on their unique fundamentals rather than treating crypto as a monolithic block.
Is the 'Greed' reading on the Fear & Greed Index still relevant if the market dipped?
Yes, it is. A 'Greed' reading of 75, even with a slight decline, indicates that overall market sentiment remains bullish despite the recent dip. It means that while there was a short-term sell-off (likely triggered by macro events), the underlying psychological predisposition of the market is still optimistic. A peak in the index, as noted by some analysts, can sometimes precede a correction, acting as a warning sign that the market might be getting a little too far ahead of itself.

Ready to start your journey with us?
Trusted by over 100,000 users from around the world.
