
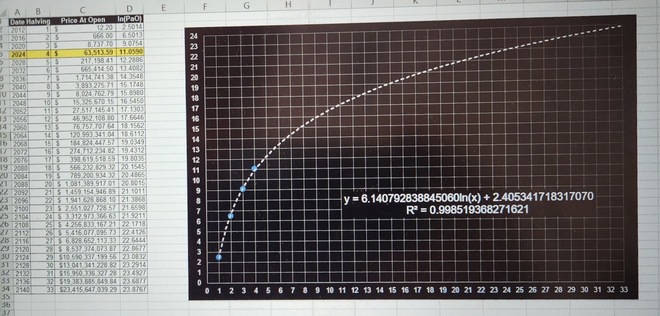
Let’s take a look at the correlation between the $BTC logarithmic opening price at the halving dates and the $BTC Halving Power Law… 👀 Crazy accurate, don’t you think ?! 🤩 If we extrapolate out the Power Law equation until 2140, we should have a possible glimpse of the future… 🚀🚀🚀 The X-axis is the halving number and the Y-axis is the ln(price at opening).
Înapoi la Strategii
CRYPTONICSPerformanța Strategiei
CRYPTONICSPerformanța Strategiei
Avertizare de risc
|Dezvăluirea Datelor
De la
apr. 29, 2024
Către
mai 6, 2024
CRYPTONICS
Bitcoin
Despre această Strategie
Despre această Strategie
Cryptonics este o strategie gestionată în mod activ și utilizează analiza tehnică și indicatori proprii personalizați pentru a tranzacționa în mod activ cu reguli de automatizare, luând în considerare în același timp știrile importante de pe piața cripto și bursieră.
Performanță & Risc
Performanță & Risc
Randament Anualizat
+2,30 %
Tragere max.
-66,76 %
Randament
-1,60 %
Volatilitate
+2,57 %
Structură
Structură
Modificări de structură
Modificări de structură
Ultima modificare a structurii
12 apr. 2024, 22:50:16
Numărul modificărilor de structură din ultimele 30 de zile
3
Postări
CRYPTONICS
11 nov., 2023
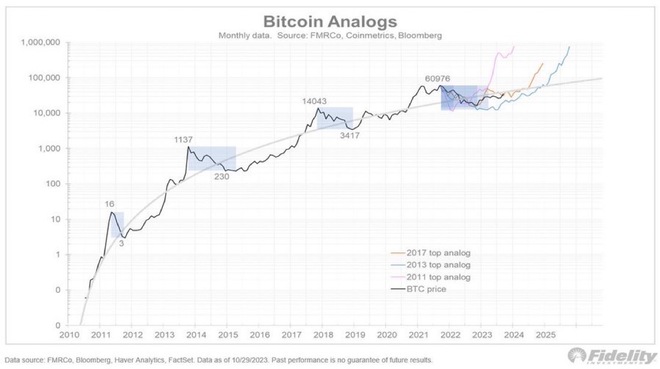
If Fidelity Investments is posting $BTC price projections like this, then bullish it is… 🚀
Unei persoane îi place asta
CRYPTONICS
8 nov., 2023
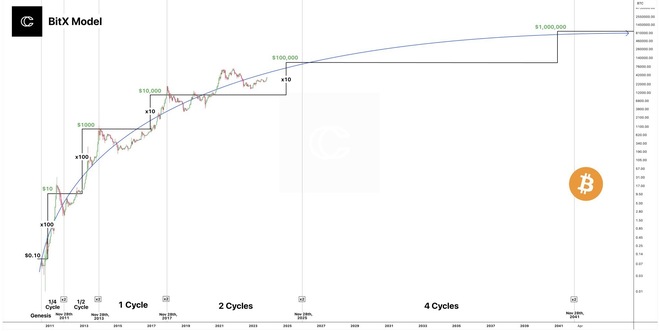
Interesting theoretical $BTC price model… 👌🏻Let’s see in 2025 if it was spot on… 🤞🏻 Bitcoin has never found a solid price model that factors in diminishing returns, until now. BitX, which explains why Bitcoin was not able to reach 100k last cycle, and why it should this cycle. Using the Halving Cycles Theory, we can determine strict time frames to abide by. The Theory says that cycles operate in a 4-part, 4-year cycle centered around the date of November 28th. At inception, price was much easier to move. Bitcoin moved at a first-cycle pace of 100x from 10 cents to 10 dollars which took a quarter cycle (1 year). BitX says that all moves will increase in time to achieve, by a factor of 2. The second move also increased by 100x, to $1000. This took a half cycle (2 Years) After the first cycle, where price could create more outstanding leaps and bounds, the increase factor diminished to 10x, where we are now. It then took 1 full cycle to reach $10,000, the 10x multiple of the previous tier. The reason last cycle was not able to achieve 100k, was that it now takes 2 cycles from the previous to reach 100k. You can see that most cycles slightly overshoot their targets. We can then even determine the time it would take to reach 1,000,000 which would be 4 cycles, or by late 2041. Diminished returns are now accounted for based on history, 100k (and above) should finally be next. Scheduled to come +/- 21 days from Nov 28th 2025 according to the Halving Cycles Theory.
Unei persoane îi place asta
CRYPTONICS
2 nov., 2023
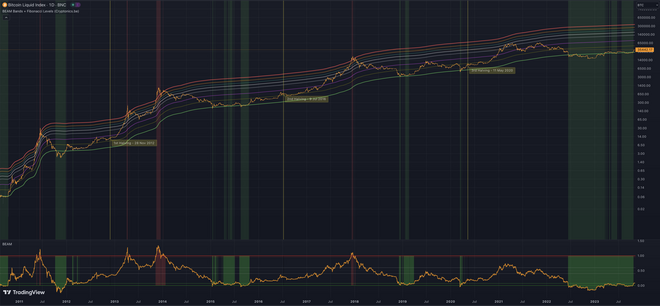
The BEAM ("Bitcoin Economics Adaptive Multiple") indicator gives you a great high level overview when to buy (🟩zone) and sell (🟥zone). Notice 👀the bullruns 🚀after the $BTC halvings... Check our free live indicator here: https://tradingview.com/chart/pNGQJMsz/
6 persoane apreciază asta
CRYPTONICS
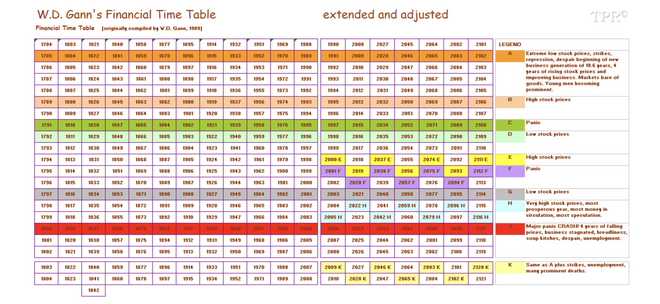
8 oct., 2023
Always fun to see what these cycle projections have in petto for the future… 😉 Reportedly W.D. Gann constructed his legendary Financial Time Table on August 8th, 1908, without an ephemeris. Gann himself has been quoted as saying that this was his greatest market discovery. It is entirely based on the moon’s north node, which completes a full cycle every 18.6-years. This is the same cycle that Louise McWhirter used to predict the stock market as well. To mimic the Lunar Declination Cycle Gann simply alternated a sequence of +19, +18, +19, +18 etc.-years across the top to get an average length of 18.6-years. However, he finally noted that an adjustment would finally be due for Dec 25th, 1989. The above table adjusted the pattern to the ephemeris. The Financial Time Table predicts years of recessions, depressions, high stock prices, panics, low stock prices, speculative times, stock market crashes, labor strikes and so on. The legend at the right of the table reads as follows: A - Extreme low stock prices, strikes, repression, despair, and beginning of new business generation for 18-3/5 years. 4 years of rising stock prices and improving business, markets bare of goods. Young men becoming prominent. B - High stock prices. C - Panic D - Low stock prices. E - High stock prices. F - Panic G - Low stock prices. H - Very high stock prices most prosperous year, waste over extravagance, most money in circulation, much speculation. J - Major Panic-CRASH! 4-years of falling prices, business stagnated, breadlines, soup kitchens, despair, and unemployment. K - Same as A plus strikes, unemployment, many prominent deaths. W.D. Gann also observed what he came to call the “decade cycle”. In his many commodity and stock market courses, he described the decade cycle this way: By studying the yearly high and low chart and going back over a long period of time, you will see the years in which bull markets culminate and the years in which bear markets begin and end. Each decade, or 10-year cycle, which is one-tenth of 100 years, marks an important campaign… In referring to these numbers and these years, we mean the calendar years. To understand this, study 1891 to 1900, 1901 to 1910, 1911 to 1920, 1921 to 1930 and 1931 to 1939. The ten year cycle continues to repeat over and over, but the greatest advances and declines occur at the end of the 20-year and 30year cycles, and again at the end of the 50-year and 60-year cycles, which are stronger than the others.
5 persoane apreciază asta
Află mai multe
Cum se Cumpără CriptoManagementul Portofoliului CriptoPentru afaceriCaracteristicile platformeiProgram de afiliereInvestiții pe termen lungBlogDivulgarea taxelorDezvăluirea RiscurilorCentru asistență (ENG)Prețuri de Cripto Live
Prețul Bitcoin în USDPrețul Ethereum în USDPrețul Doge în USDPrețul Cardano în USDPrețul Solana în USDIntră în contact
Biroul de trading:
256-260 Old Street, London EC1V 9DD
Deschis: Doar cu programare
Vânzări și întrebări B2B:
+44 (0) 20 3376 0820Contactează Asistența (ENG)Sugerează o funcție (ENG)© 2024 ICONOMI Limited
©ICONOMI is the trading name of ICONOMI Limited, a company registered in England and Wales. Registered address 8 Coldbath Square, London EC1R 5HL, United Kingdom. Company Registration number: 11087795. ICONOMI Limited is registered with the Financial Conduct Authority (Firm Reference No. 927859).