
Stellar (XLM) Analysis - Latest Developments
On July 28 XLM to USD Price was $0.1617 and Stellar Market Cap $4.41B. Return in the last 24 hours was +4.45 %, return in the last month was +57.86%.
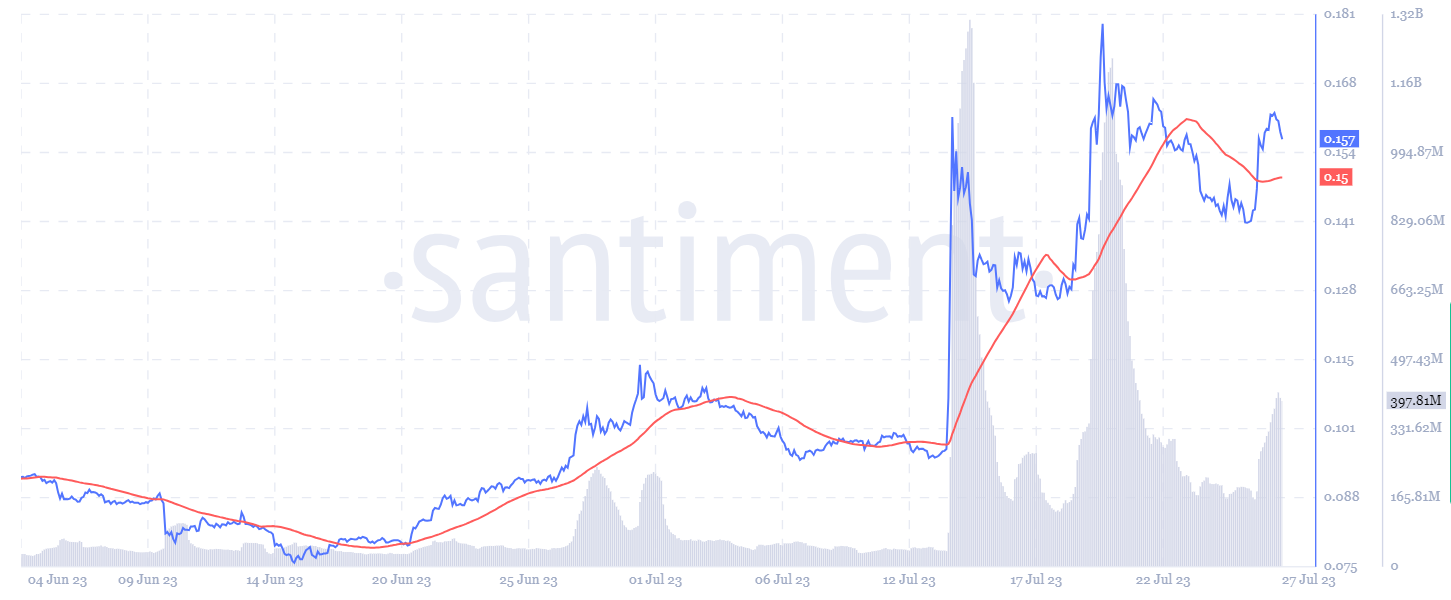
We can clearly see in the picture below the rising price of XLM from June 1 up to July 27 with Moving Average (50) and trading volume.
Stellar's trend has shifted from a downtrend to an uptrend after breaking out of a Falling Wedge pattern. The price surged to $0.19, becoming overbought (RSI > 75), leading to profit-taking and selling pressure. Currently, the price is consolidating in a Bullish Flag pattern, which often indicates a continuation of the uptrend.
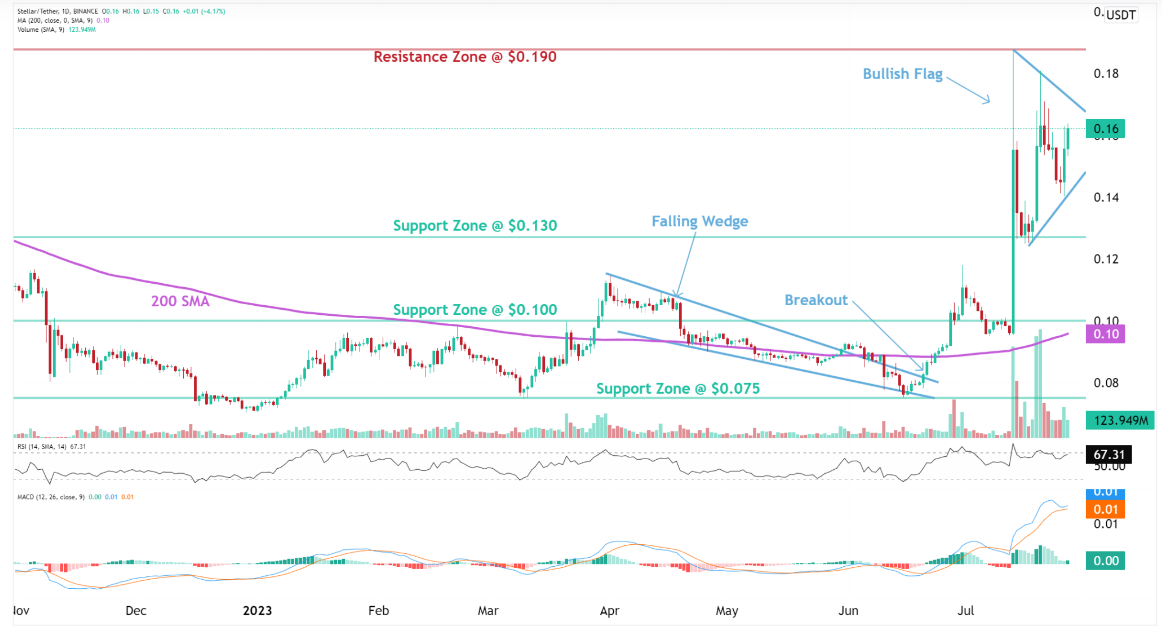
The observed Bullish Flag pattern is a short-term rectangle trading range between diagonal parallel lines. It typically follows a sharp advance and suggests a temporary change in direction or consolidation before the previous trend resumes. Bullish Flags are reliable continuation patterns, offering traders an opportunity to enter an existing trend that could continue. Traders usually initiate trades on a breakout, preferably in the same direction as the prevailing trend. While a breakout with increased volume is favourable for bullish flags, it's not a strict requirement.
Stellar is currently experiencing an Uptrend across all time horizons, including Short-Term, Medium-Term, and Long-Term. This indicates an overall positive outlook for the cryptocurrency.
The momentum for Stellar is currently bullish, as shown by the MACD Line being above the MACD Signal Line, and the RSI reading being above 55. However, there are signs that momentum may be weakening, as indicated by the declining MACD Histogram bars.
The nearest Support Zone for Stellar is located around $0.130, which previously acted as a resistance level. If the price experiences a pullback, this support level may provide a floor for the cryptocurrency. Further support can be found at $0.100. On the upside, the nearest Resistance Zone is at $0.190, which represents the previous high reached during the recent spike.
The technical analysis points to a bullish outlook for Stellar (XLM) due to the uptrend across all time horizons and the formation of a Bullish Flag pattern. However, traders should remain cautious, considering potential profit-taking at the $0.19 resistance level and the weakening momentum indicated by the declining MACD Histogram bars. Monitoring a breakout from the Bullish Flag with a price alert can help traders take advantage of potential upward movements.

Ready to start your journey with us?
Trusted by over 100,000 users from around the world.
