2023/2024 In Crypto - ICONOMI Yearly Wrap
What a year it's been for the cryptocurrency market, Bitcoin is up 169% from its bear market low and Solana is up 684% YTD - to name a couple...
Significant gains were made this year before the Bitcoin halving event in April 2024, and the potential approval of a Bitcoin Spot ETF in January 2024.
In this report, we are taking a deeper dive into Bitcoin and the underlying mechanics driving the cryptocurrency market.
What is in store:
- Bitcoin Spot ETF Update
- Institutional inflows v outflows
- Technical breakdown - Bitcoin weekly log chart & Bitcoin halving spiral chart
- Bitcoin wallet growth
- FED & Interest rates
- Winners & Losers - YTD performance of different sectors in the cryptocurrency market
Bitcoin Spot ETF update:

In 2023 we have witnessed multiple institutional applications for Bitcoin Spot ETFs in the US with the SEC, and so far all decisions have been postponed by the SEC.
However, this week BlackRock updated its Bitcoin Spot ETF application on the 18th of December, allowing for cash redemptions. Recently, BlackRock also listed the planned Bitcoin ETF on the US securities market’s main clearing house. This is a common activity for new or upcoming ETFs in search of fresh capital.
To appease authorities (the SEC), Blackrock filed a revised spot Bitcoin ETF proposal, possibly increasing its chances of obtaining a first-of-its-kind clearance in the US. The amended proposal calls for Blackrock's ETF to include cash production and redemption methods, which the SEC prefers. The Bitcoin spot ETF deadline is quickly approaching, with January 10th, 2024 serving as a historic moment.
Last week, we saw the end of 11 straight weeks of positive institutional inflows into digital asset-related investment products, with insignificant withdrawals in the area of $16 million, indicating potential profit-taking after Bitcoin's price had risen by an eye-watering 169% year-to-date. Bitcoin has received more than $1.6 billion in institutional inflows so far this year, spurred by expectations that the SEC may approve a Bitcoin Spot ETF shortly.
BlackRock has a very successful track record of listing ETFs, applying for a total of 776 ETFs, and having 775 approved.
Institutional Inflows/Outflows
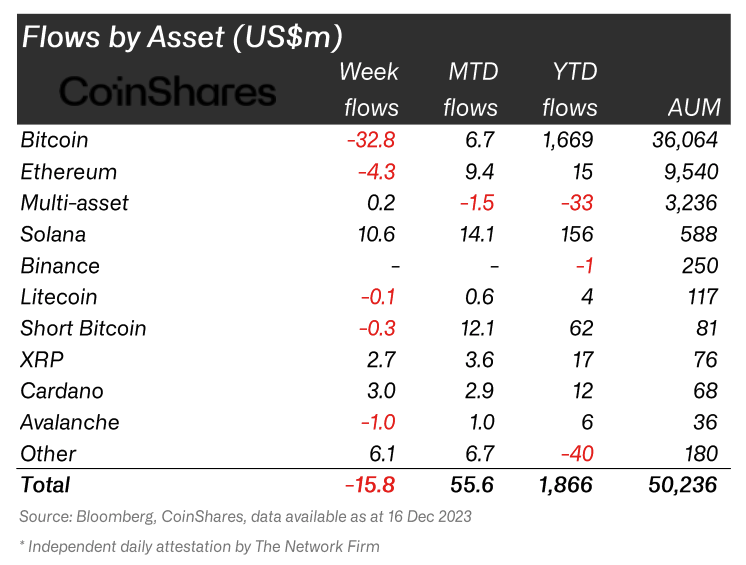
It should come as no surprise that Bitcoin has taken the lion's share of inflows this year, with CoinShares reporting inflows totalling $1.669 billion YTD. Solana had large institutional inflows this year, with the second-highest YTD inflows of $156 million. Last week, Solana received the biggest inflows of $10.6 million, while Bitcoin experienced slight losses of $32.8 million. This suggests that investors are perhaps reducing their exposure and reaping some profits ahead of the Bitcoin Spot ETF application deadline on January 10th.
Bitcoin is currently consolidating near the $44,000 level, which appears to be a crucial psychological level from a technical standpoint. However, both the long-term log chart and spiral chart of Bitcoin support a bullish trend.
Technical Breakdown:
Bitcoin Weekly Log Chart
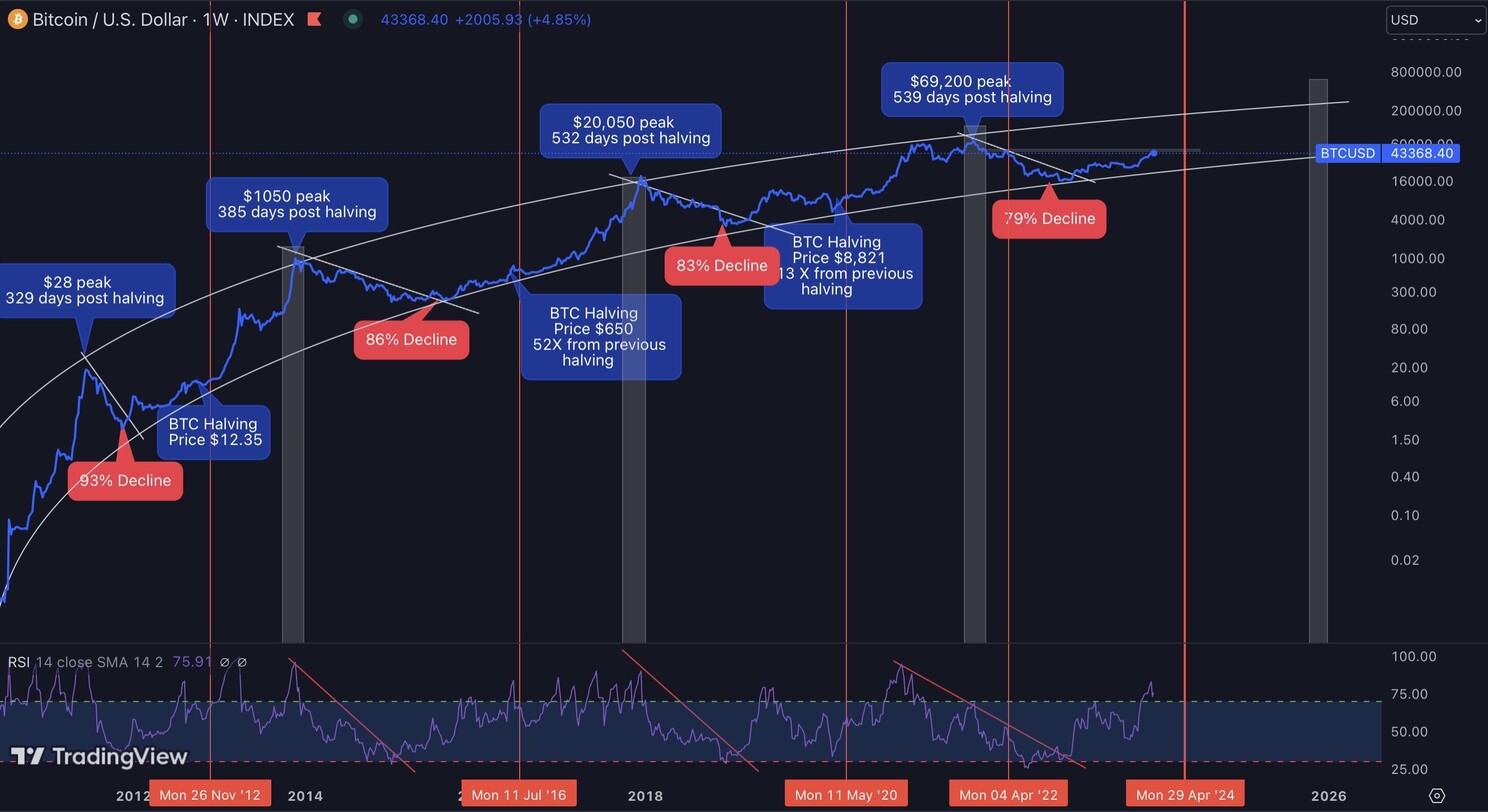
Bitcoin is still trading within the rising channel structure that has held strong throughout the bear market phase. Interestingly, if we break down the historical bull and bad market data we can develop market averages.
Bitcoin has traditionally reached a bear market low 400 days before a halving event. With the next halving event scheduled for April 2024, we could forecast that the bear market low should have occurred in Q1 2023. Bitcoin did, in fact, bottom in November 2022, two months earlier than market averages. Furthermore, 1.5 years following a halving event, Bitcoin tends to peak. This would imply that Bitcoin would remain in a bull market phase until roughly Q4 2025 - the last three bull market peaks have all happened in the fourth quarter of the year.
Bitcoin Halving Spiral
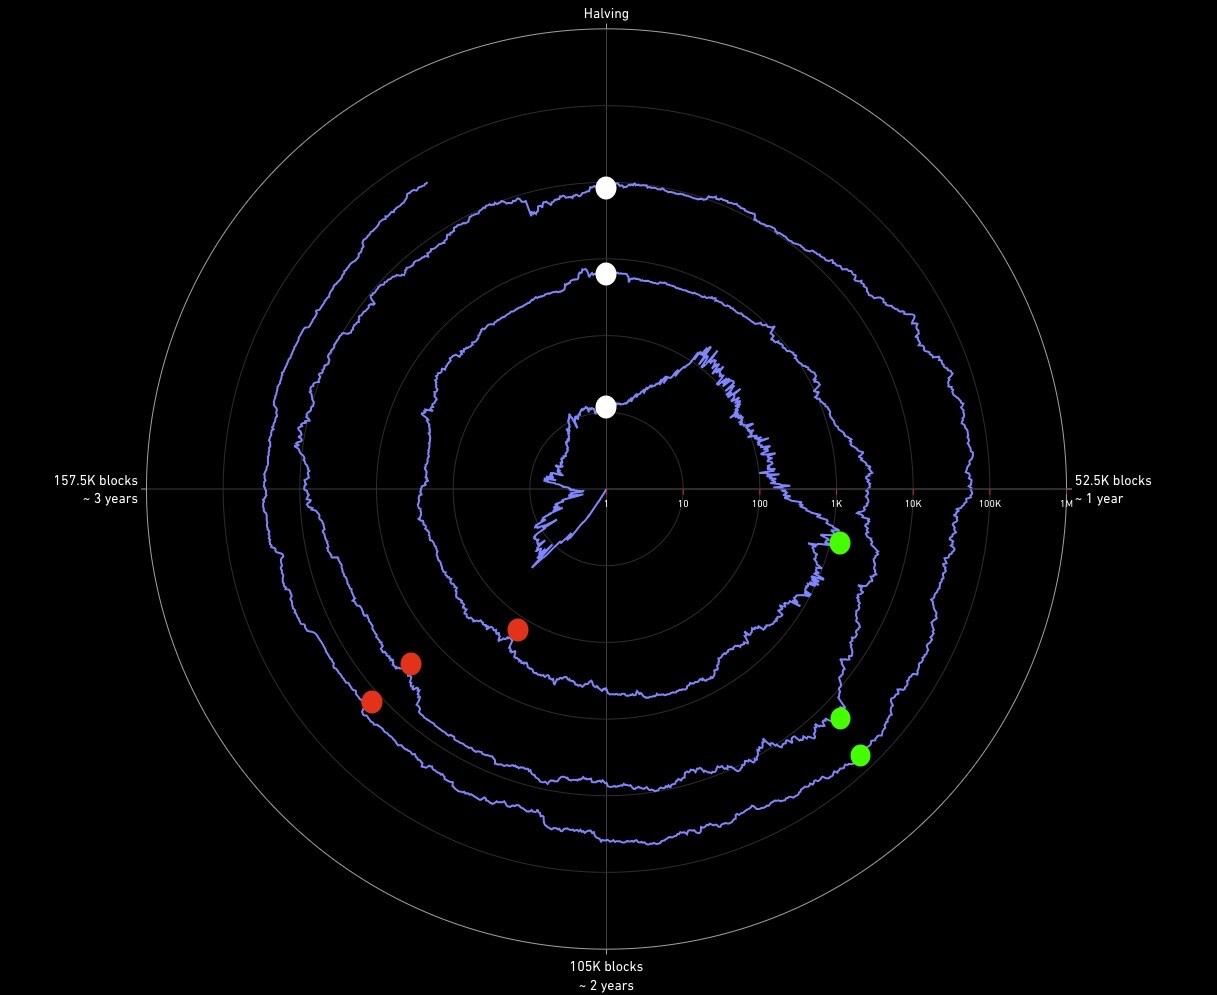
Analysing Bitcoin in terms of blocks mined X price, rather than time X price, allows for a more in-depth look at market averages. Every lap around the spiral represents 4 years.
1) The white circle represents Bitcoin halving events.
2) The green circle represents bull market tops.
3) The red circle represents bear market lows.
The 4-year cycle of Bitcoin is dictated by blocks mined rather than time. Each year, 52,500 blocks of Bitcoin are mined (1 quarter of the spiral), implying that 210,000 blocks of Bitcoin are mined in the four years between halving events.
Every mined block contains 6.25 BTC, and 144 Bitcoin blocks are mined each day. This equates to an increase in the supply of 900 Bitcoin every day (at the current rate, which will be cut in half in April 2024).
Looking at previous cycles, we can observe that Bitcoin often peaks halfway through the second year, around block 78,750 (about 1.5 years after halving). Furthermore, Bitcoin bear market bottoms generally occur around halfway through the third year of the cycle. After a halving occurrence, Bitcoin has typically bottomed at block 131,250 (about 2.5 years later).
This cycle can and will most likely change depending on the number of miners in circulation and the strength and power of the new miners coming into the market.
Who holds what...
Bitcoin address holding >X BTC by year
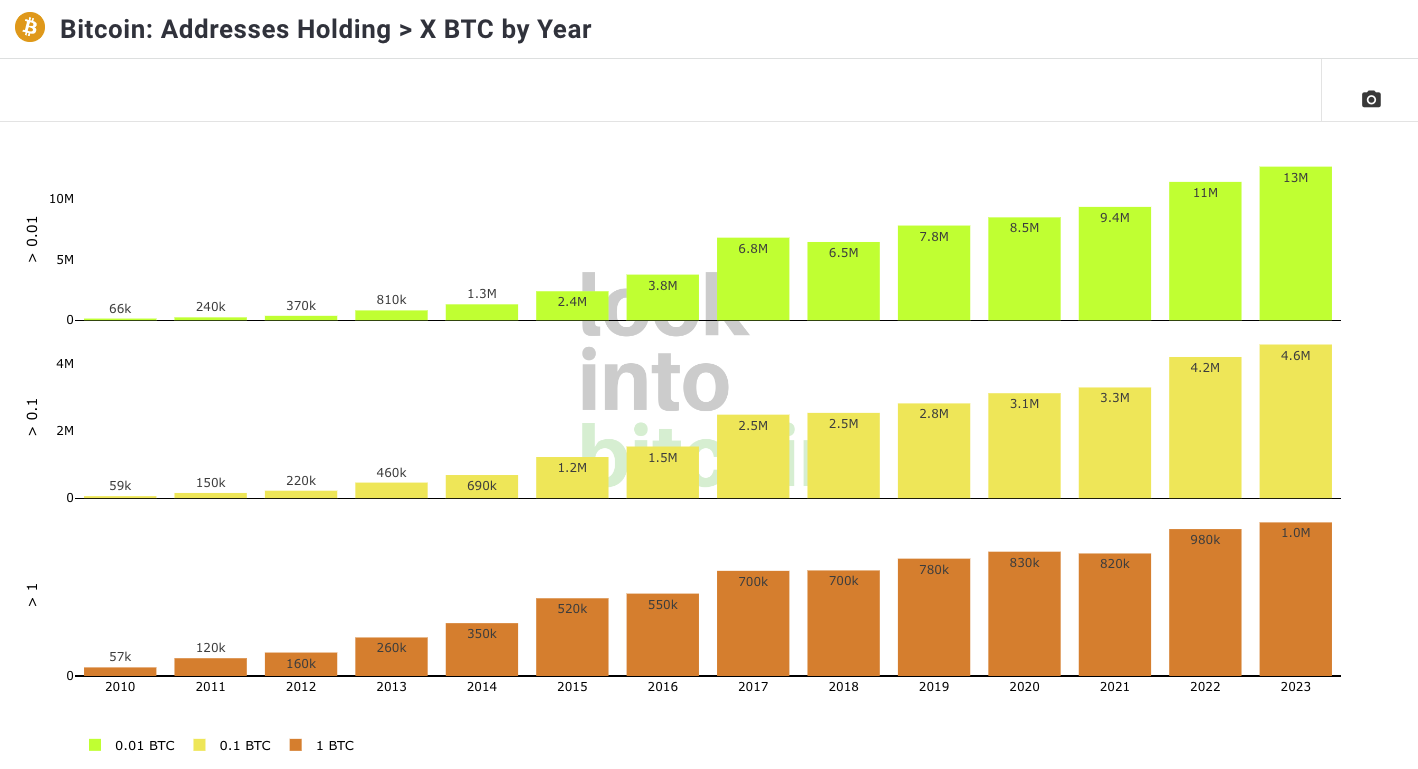
Over the last year, the number of Bitcoin wallet addresses holding more than 0.01 BTC has increased from 11 million to 13 million. The number of Bitcoin wallet addresses holding more than 0.1 BTC has increased from 4.2 million to 4.6 million, while the number of Bitcoin wallet addresses holding more than 1 BTC has increased from 980k to well over one million.
The total number of Bitcoin wallet addresses holding more than 0.01 BTC went from 16,180,000 in 2022 to 18,600,000 in 2023, signifying a 15% rise in Bitcoin wallet addresses holding more than 0.01 BTC. This signifies a positive growing adoption rate, whilst the pre-determined inflation rate of Bitcoin continues to decline. Bitcoin currently has an inflation rate of 1.74%. Decreasing supply and growing demand is only positive for long-term price appreciation.
It is important to note that the figures will be skewed for several reasons, investors can have access to multiple addresses, furthermore, an exchange that manages thousands of investors will only be classed as 1 address.
FED & Interest Rates
After one of the most aggressive rate hiking cycles in history, a regional banking crisis, a bond market crash and a stock market "crash" throughout 2022 and early 2023, the FED has potentially arrived at the top end of the rate hiking cycle.
Speculation that the FED has now completed its rate hikes and that they will begin cutting rates as early as March 2024 is pushing risk assets and hard assets to new highs. Just this week we have seen a record high on the S&P500, the NASDAQ and DOW JONES index.
According to CME's FedWatch Tool, expectations for a U.S. rate cut of at least 25 basis points (bps) in March have increased from roughly 35% to roughly 64%. LSEG data shows that markets are pricing in a 74% possibility of an ECB rate cut in March 2024.
Not only is the market expecting a rate cut in March, but there is ongoing speculation that the FED will cut rates 3 times next year. Despite a positive sentiment across risk assets, caution is warranted as recession fears in 2024 are still lingering on the horizon.

Currently, the FED is still winding down its balance sheet, which typically is negative for risk assets.
However, if a recession were to unfold, which is still a possibility, Central Banks tend to provide liquidity in support of the financial markets, lowering interest rates and adding to its balance sheet. Digital assets, Bitcoin in particular, will stand to benefit a great deal from lower interest rates and easier financial market conditions, benefiting from increased liquidity and a weaker fiat currency (USD).
Winners & Losers
YTD performance of different sectors in the cryptocurrency market (highest performing to lowest):
The top 10 AI coins by market cap and volume have an average YTD return of 677%:
- INJ +2,284%
- TAO +275%
- RNDR +1,041%
- GRT +210%
- ROSE +177%
- AKT +1,174%
- FET +691%
- AGIX +661%
- OCEAN +239%
The top 10 layer 2 coins by market cap and volume have an average YTD return of 349%.
- MATIC +14.75%
- IMX +459%
- INJ +2,284%
- MNT +17.50%
- DYDX +174%
- SNX +194%
- OP +139%
- GMX +20.12%
- LRC +37.56%
- ZRX +156%
The top 10 Proof-of-Work coins by market cap and volume have an average YT return of 299%.
- BTC +160%
- DOGE +40.98%
- LTC +6.49%
- BCH +139%
- XMR +15.91%
- ETC +31.60%
- KAS +2,405%
- ZEC -20.60%
- SC +229%
- DASH -15.29%
The top 10 Metaverse coins by market cap and volume have an average YTD return of 176%.
- WEMIX +951%
- SAND +35%
- THETA +51.82%
- MANA +71.27%
- AXS +20.86%
- ILV +156%
- ENJ +45.22%
- WAXP +77.70%
- MAGIC +69.85%
- SURE +292%
The top 10 layer 1 coins by market cap and volume have an average YTD return of 160%.
- BTC +160%
- ETH +91.18%
- BNB +1.58%
- XRP +85.48%
- SOL +693%
- ADA +166%
- AVAX +271%
- DOGE +40.98%
- TRX +92.14%
- TON +4.40%
The top 10 Proof-of-Stake coins by market cap and volume have an average YTD return of 144%.
- ETH +91.18%
- SOL +693%
- ADA +166%
- AVAX +271%
- TRX +92.14%
- TON +4.40%
- DOT +68.67%
- MATIC +14.75%
- ATOM +20.67%
- ALGO +22.01%
AI appears to be leading the charge in this early stage of the bull market cycle, despite "alt-coin season" not officially starting. Bitcoin is continuing to follow its typical trajectory, both from a log chart and spiral chart perspective. Institutional investors have attempted to front-run the potential Bitcoin Spot ETF approval, which is currently driving prices higher, alongside expectations of easier financial market conditions next year. The potential Bitcoin Spot ETF and Bitcoin Halving event will create two supply shocks next year, whilst reducing the supply of Bitcoin in circulation.
Want to view the available digital asset portfolios on the ICONOMI platform:
https://www.iconomi.com/strategies#filters
If you want to learn more about the Cryptocurrency market - Schedule a 1-on-1 consultation with the author Anthony Fernandez - Head of Business Development at ICONOMI:
https://calendar.app.google/iPZS7n6Yq1xym54w7
Risk Warning: Cryptocurrency is classed as a high-risk investment. Previous returns do not guarantee or guidance of future performance. Don’t invest in cryptocurrency unless you’re prepared to lose all the money you have invested. This is a high-risk investment and you should not expect to be protected if something goes wrong. Take 2 mins to learn more.

